Annual Operating Plan: A Guide for Growing Companies
An annual operating plan (AOP) is a company's one-year plan for turning strategy into results. It sets the revenue target, budget, key objectives, owners, and measures for the coming financial year, and it shows how resources will be allocated to reach them. A good annual operating plan is a working management tool, not just a document filed after budget season.
Most growing companies already have a strategy and some form of budget. The gap is usually the bridge between the two. This guide explains what an annual operating plan is, what it should include, how it differs from a strategic plan and a budget, how to build one step by step, and how leadership teams keep the plan alive through the year.

What Is an Annual Operating Plan?
An annual operating plan translates strategy into the specific goals, resources, and actions a company commits to for the upcoming year. Where a strategic plan describes long term direction, often over three to five years, the AOP answers a narrower question: what will we do this year, with what money and people, and how will we know it is working?
Many companies call it the AOP, the annual plan, or the operating plan. Whatever the name, the annual operating plan AOP usually has three parts that fit together:
- Strategic context: the company's strategic vision and the few strategic objectives that matter most this year.
- Operational plan: the key objectives, initiatives, owners, timelines, and key performance indicators for each team.
- Financial plan: the revenue plan, operating budget, headcount, and cash flow assumptions that fund the work.
When these three parts agree, the leadership team can make informed decisions during the year because everyone is working from the same plan.
Why the Annual Operating Plan Matters
Without an operating plan, a strategy tends to stay abstract. Teams set their own priorities, budget requests compete without a shared logic, and leaders discover in the third quarter that the year's goals were never resourced.
A clear annual operating plan helps a leadership team:
- Connect strategy to daily tasks. Each department can see how its objectives support the company's strategic goals.
- Allocate resources on purpose. Allocating resources against agreed priorities is easier than defending last year's budget line by line.
- Create shared ownership. Every major objective has a clear owner and a measurable target.
- Track measurable progress. Leading indicators and key metrics show early whether the plan is on track.
- Adjust with discipline. A plan with a review cadence makes data driven adjustments routine rather than a crisis.
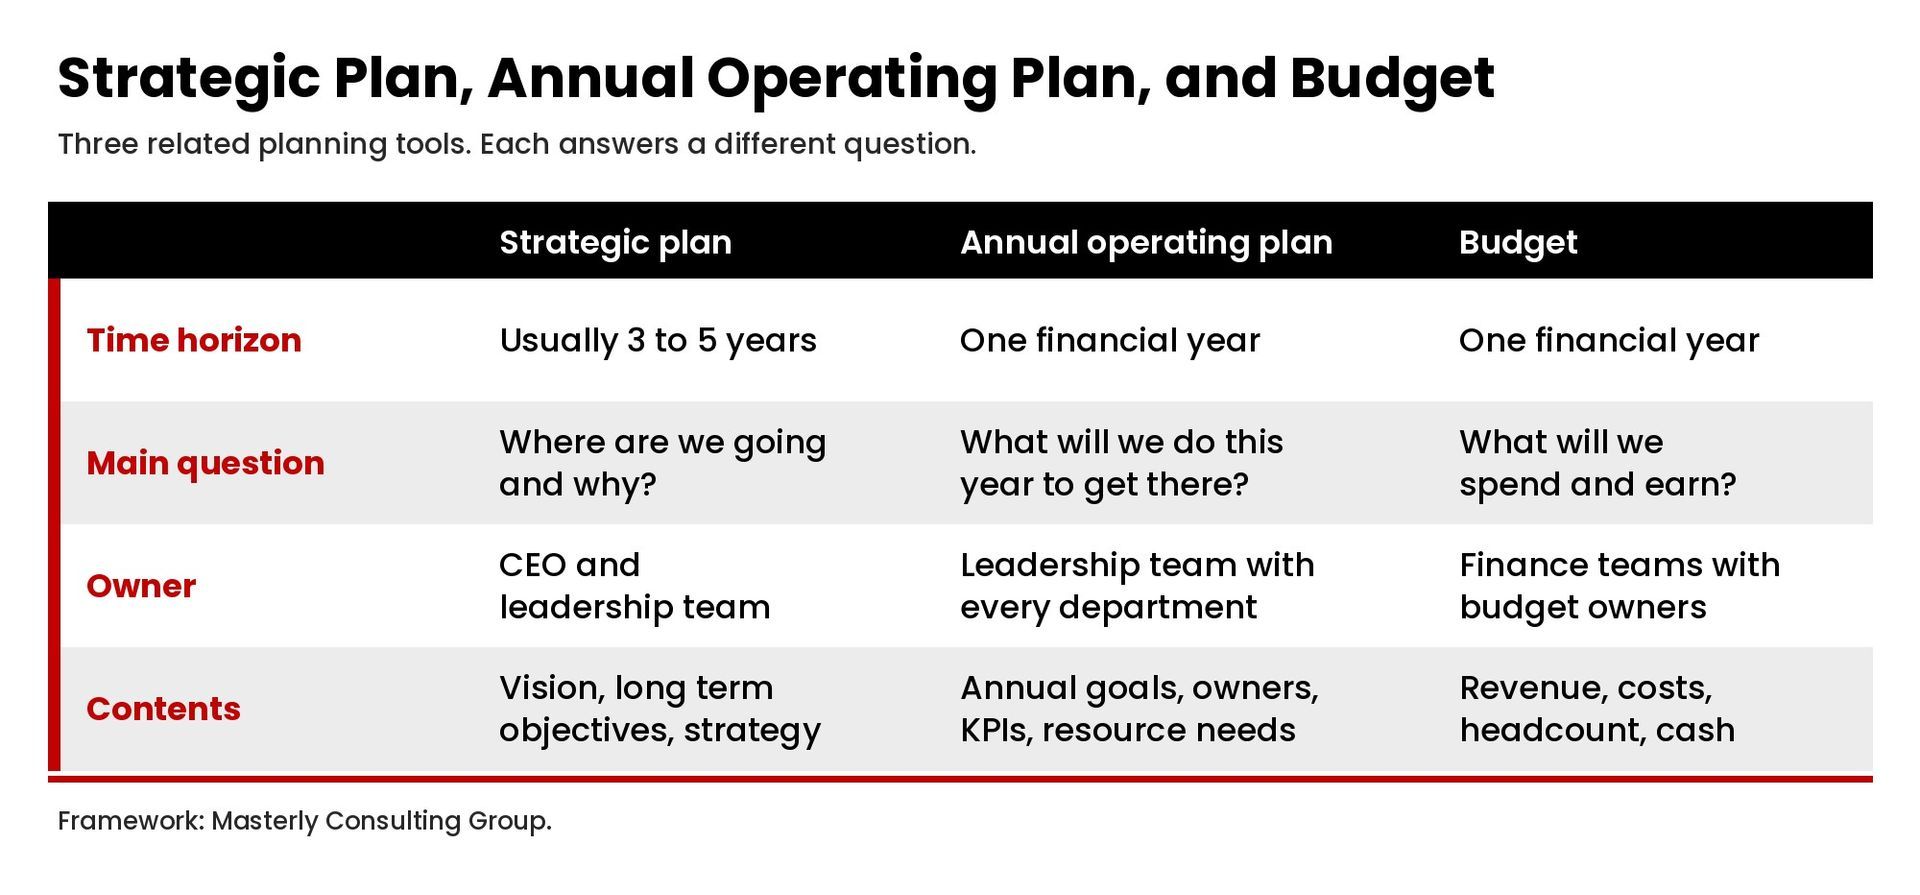
Annual Operating Plan vs. Strategic Plan vs. Budget
These three planning documents are related, but they answer different questions.
Is an Annual Operating Plan the Same as a Budget?
No. The budget is one part of the annual operating plan. The budget shows the numbers; the AOP explains what those numbers will buy, who owns each objective, and how success will be measured. A budget without an operating plan tells you what you can spend, but not what the spending is supposed to achieve.
What Should an Annual Operating Plan Include?
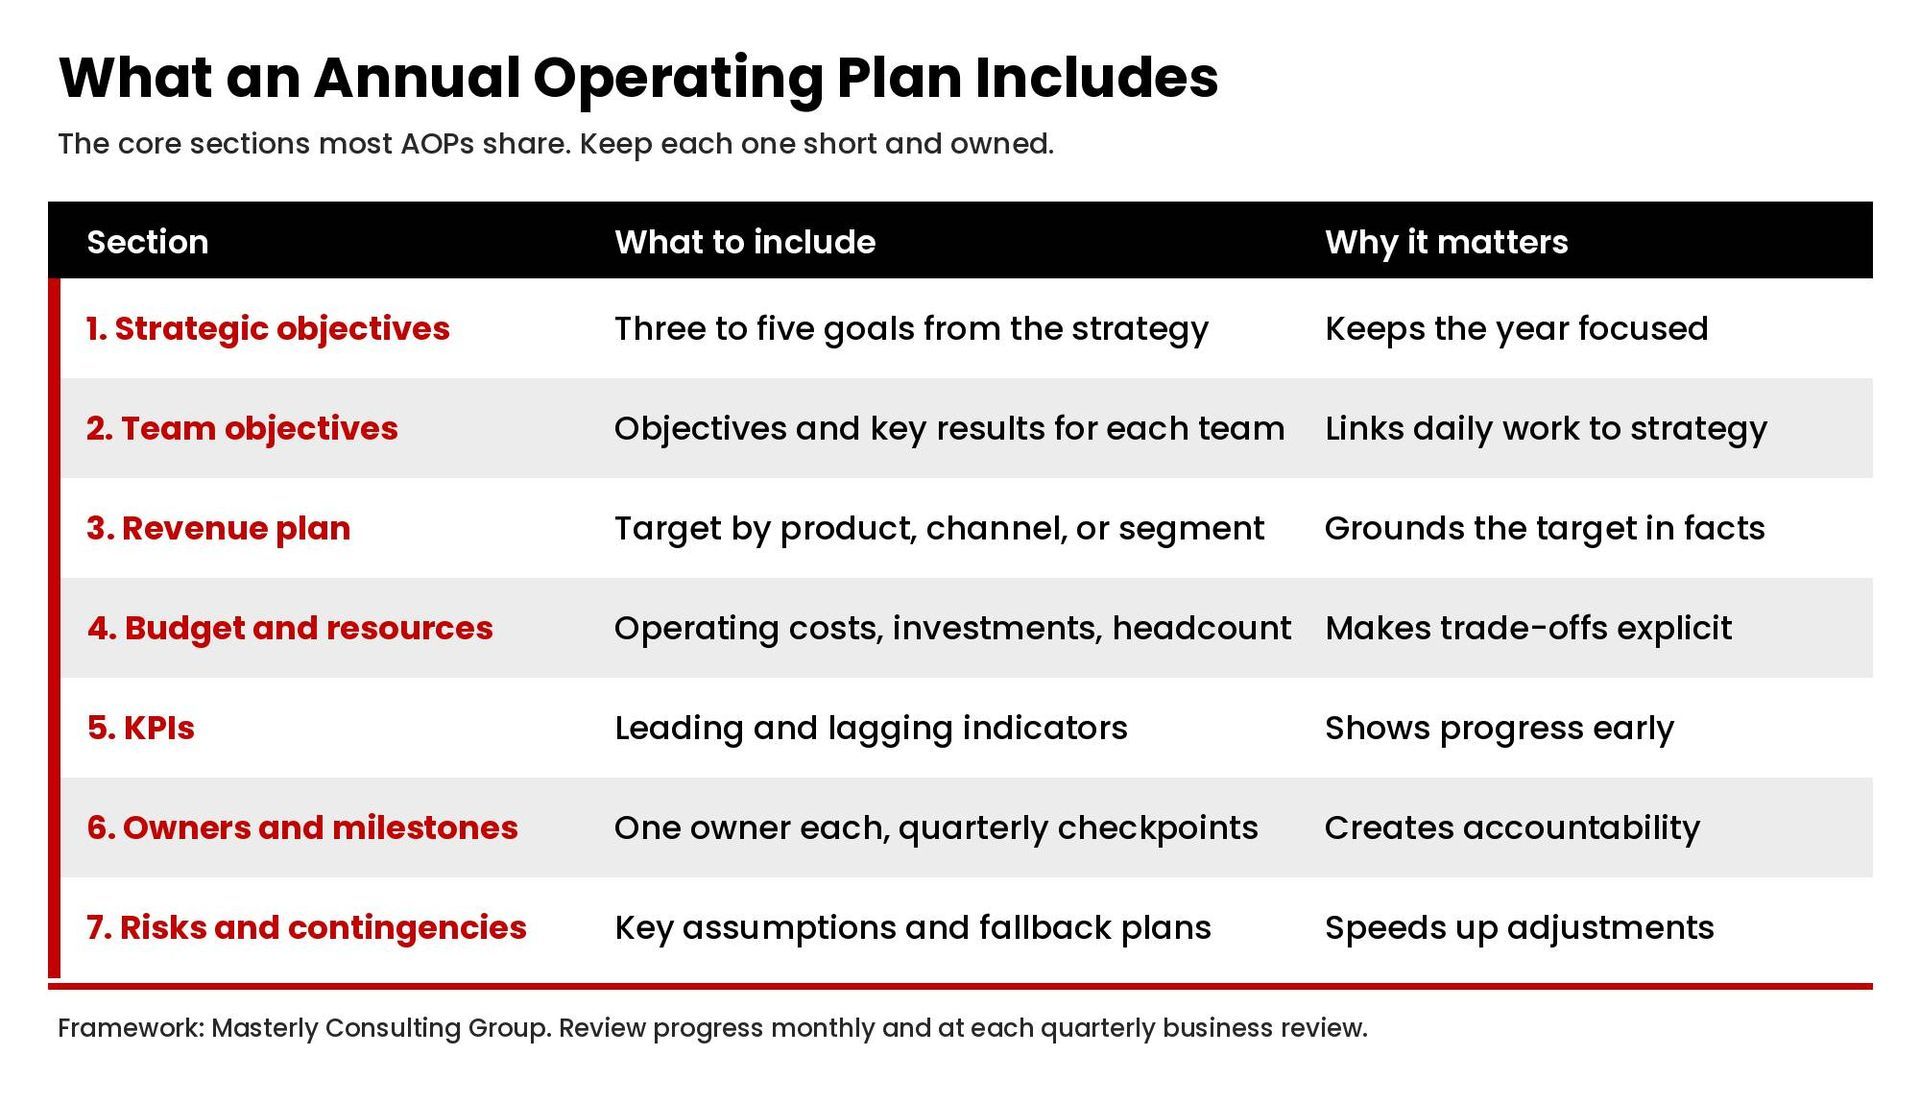
The exact format varies, but most annual operating plans cover the same core elements.
Strategic Objectives for the Year
Start with three to five strategic objectives that come directly from the long term strategy. Too many objectives spread resources thin; a short list keeps the plan focused.
Key Objectives and Key Results by Team
Translate each strategic objective into team-level objectives with measurable targets. Many companies use objectives and key results for this step; see our OKR framework guide for how to write them.
Revenue Plan and Revenue Model
Set the revenue target and show how it will be reached: by product, channel, segment, or region. Tie the revenue plan to realistic assumptions about pricing, customer acquisition, and retention, based on historical data where you have it.
Operating Budget and Resource Needs
List the operating expenses, capital investments, and headcount each objective requires. This is where resource allocation decisions get made explicit.
Key Performance Indicators
Choose a small set of key performance indicators for the company and each team. Include leading indicators, such as pipeline or on-time delivery, alongside lagging results like revenue and margin. Some companies also track customer measures such as net promoter score.
Owners, Timelines, and Milestones
Give every objective and initiative a clear owner and a timeline with quarterly milestones, so measurable progress can be checked during the year.
Risks and Contingency Plans
Name the biggest risks to the plan and the contingency plans if a key assumption fails, such as a slower sales cycle or a delayed hire.
How to Build an Annual Operating Plan: The AOP Process
The planning process works best as a structured sequence with deadlines, usually starting in the last quarter of the current financial year.
- Review the strategy and last year's results. Begin with the strategic plan and an honest look at what worked and what did not. Historical data and lessons learned keep the new plan grounded.
- Set top down targets. The CEO and leadership team propose the year's strategic goals, revenue target, and financial goals. A top down approach sets ambition and keeps the plan aligned with the long term strategy.
- Gather bottom up plans. Department leaders respond with the objectives, initiatives, and resources needed to hit those targets. Their input tests whether the targets are achievable.
- Reconcile and prioritize. Leadership and finance teams compare the top down targets with the bottom up requests and make trade-offs. This is where the real decisions happen.
- Finalize the financial plan. Lock the budget, headcount plan, and cash flow forecast that support the agreed priorities.
- Assign owners and measures. Confirm a clear owner, measurable targets, and key metrics for each objective.
- Communicate the plan. Share the annual operating plan with the whole company so teams understand how their work connects to the company's strategic vision.
- Set the review cadence. Decide before execution begins how often the plan will be reviewed and by whom.
Key stakeholders, including department heads and finance, should be involved early. Plans built only at the top often miss operational constraints; plans built only from the bottom often miss the strategy. Buy in comes from involving both.
Keeping the Plan Alive During the Year
The most common failure of an annual operating plan is that it is treated as just a document. It is approved in the early days of the year and rarely opened again.
To avoid that, connect the plan to the company's management rhythm:
- Monthly reviews track key metrics and spending against the plan and flag issues early.
- Quarterly business reviews check progress on objectives and decide whether priorities need to change. Our guide to the quarterly business review for leadership teams covers that meeting in detail.
- Weekly leadership meetings handle decisions that cannot wait.
Together these meetings form a meeting cadence for leadership teams that turns the plan into regular feedback loops. Constructive feedback during the year is what lets the leadership team make adjustments before small misses become large ones.
Common Challenges in Annual Operating Planning
- Too many priorities. A plan with twenty initiatives is a wish list. Focus resources on the few that matter most.
- Disconnected budget and goals. If finance builds the budget separately from the operating plan, the two will conflict by spring.
- No clear owner. Objectives owned by "the team" tend to drift.
- Targets without assumptions. A revenue target with no customer acquisition or pricing logic behind it is hard to manage.
- Planning takes too long. A process that runs for months can be outdated before the year begins. Set firm deadlines.
- No review cadence. Without regular reviews, there is no moment to make adjustments.
Frequently Asked Questions
What Is in an Operating Plan?
An operating plan includes the year's strategic objectives, team objectives and key results, the revenue plan, the operating budget and resource needs, key performance indicators, owners and timelines, and the main risks with contingency plans.
What Should an Annual Operating Plan Include?
At minimum: strategic context, measurable annual goals, owners, a financial plan with budget and revenue targets, key performance indicators, and a review cadence for tracking progress during the year.
Is an Annual Operating Plan the Same as a Budget?
No. The budget is the financial part of the annual operating plan. The AOP also defines the objectives, initiatives, owners, and measures that the budget funds.
What Is AOP in HR Terms?
In HR, AOP usually refers to the people side of the annual operating plan: the headcount plan, hiring timeline, and workforce costs that support the company's objectives for the year.
When Should a Company Start Its Annual Operating Plan?
Many companies begin the AOP process in the last quarter of the current financial year, so the plan, budget, and owners are agreed before the new year starts.
Build an Operating Plan Your Team Can Use
If your annual plan feels disconnected from how the business actually runs, Masterly Consulting Group can help you turn growth goals into owners, timelines, and operating decisions. See how our strategy execution work supports the plan through the year, or contact the firm to plan your next AOP cycle.