Management Operating System: How Leadership Teams Run the Business
A management operating system is the set of routines, measures, and tools a leadership team uses to run the business week to week: how goals are set, how performance is tracked, how problems are solved, and how decisions get made. It connects strategy to daily operations, so leaders spend less time chasing updates and more time improving results.
Every company has a management operating system, whether it was designed or not. In many organizations it grew by accident: a few recurring meetings, a spreadsheet of metrics, and a lot of email. This guide explains what a management operating system is, its core components, how operating cadence fits in, how to build one, and the mistakes that keep it from working as the business grows.

What Is a Management Operating System?
A management operating system (MOS) is the structure leaders use to manage performance. Think of it as the operating system for the leadership team: it does not do the work itself, but it determines how information flows, how priorities are set, and how the team responds when something goes off track.
A well designed management operating system answers a few simple questions:
- What are our strategic goals this year and this quarter?
- Which few measures tell us whether we are on track?
- When and where do we review performance?
- Who owns each result, and how are problems escalated and solved?
- How do we capture lessons and continuously improve?
The term comes from operations management, where companies use structured routines such as daily huddles, visual performance boards, and standard work to manage frontline performance. The same logic applies to a leadership team, where the routines are usually weekly, monthly, and quarterly.
Why a Management Operating System Matters
Without a clear system, management depends on individual habits. Some leaders track performance closely, others rely on instinct, and the company's results vary with whoever is in the room.
A deliberate management operating system helps a company:
- Turn strategy into execution. Goals are broken down into measures and owners that teams can act on.
- See problems earlier. Leading indicators and regular reviews surface gaps before they reach the quarterly results.
- Make faster decisions. When every forum has a clear purpose, decisions do not wait for the next all-hands meeting.
- Reduce wasted meeting time. Existing meetings are given a purpose, merged, or retired, so time spent in meetings produces decisions.
- Scale management. As the business grows, new managers can step into a system instead of inventing their own.
The Core Components of a Management Operating System
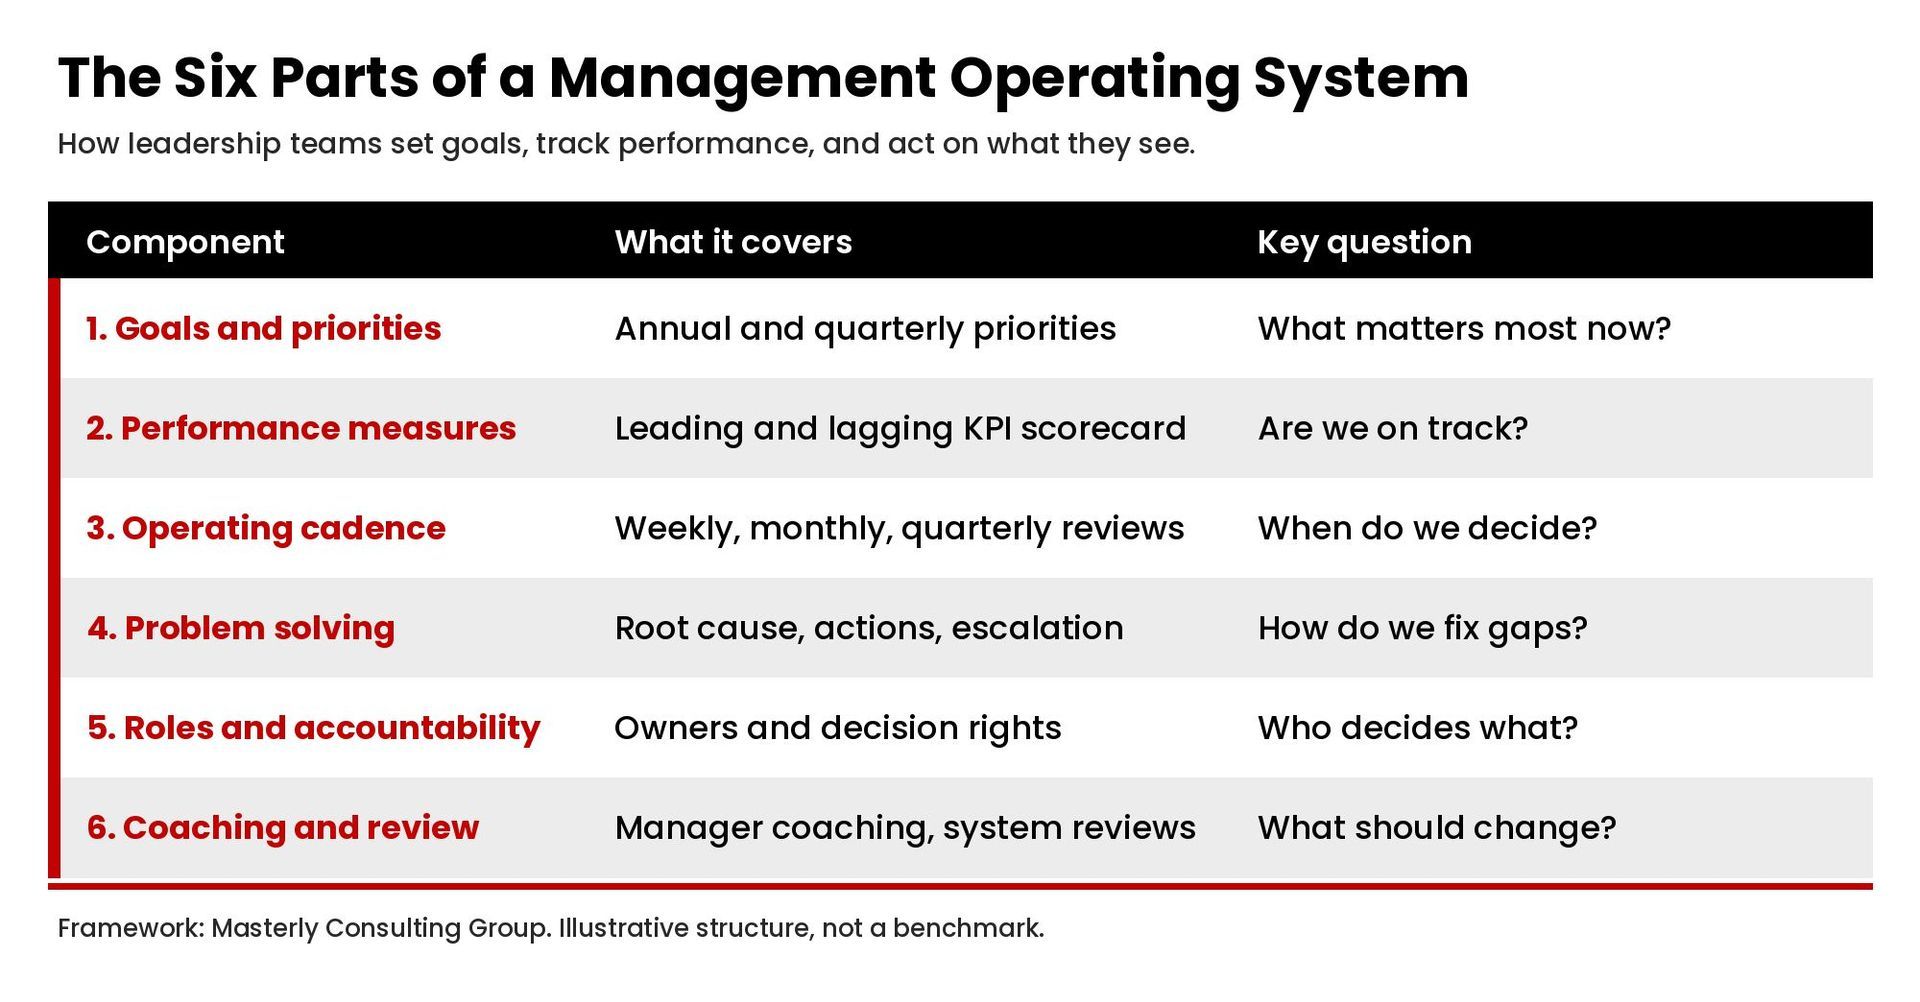
Most management operating systems have the same building blocks, even if the names differ.
Goals and Priorities
The system starts with a short list of company priorities for the year and quarter, usually drawn from the annual operating plan or strategic plan. Each priority has an owner and a measurable target.
Performance Measures
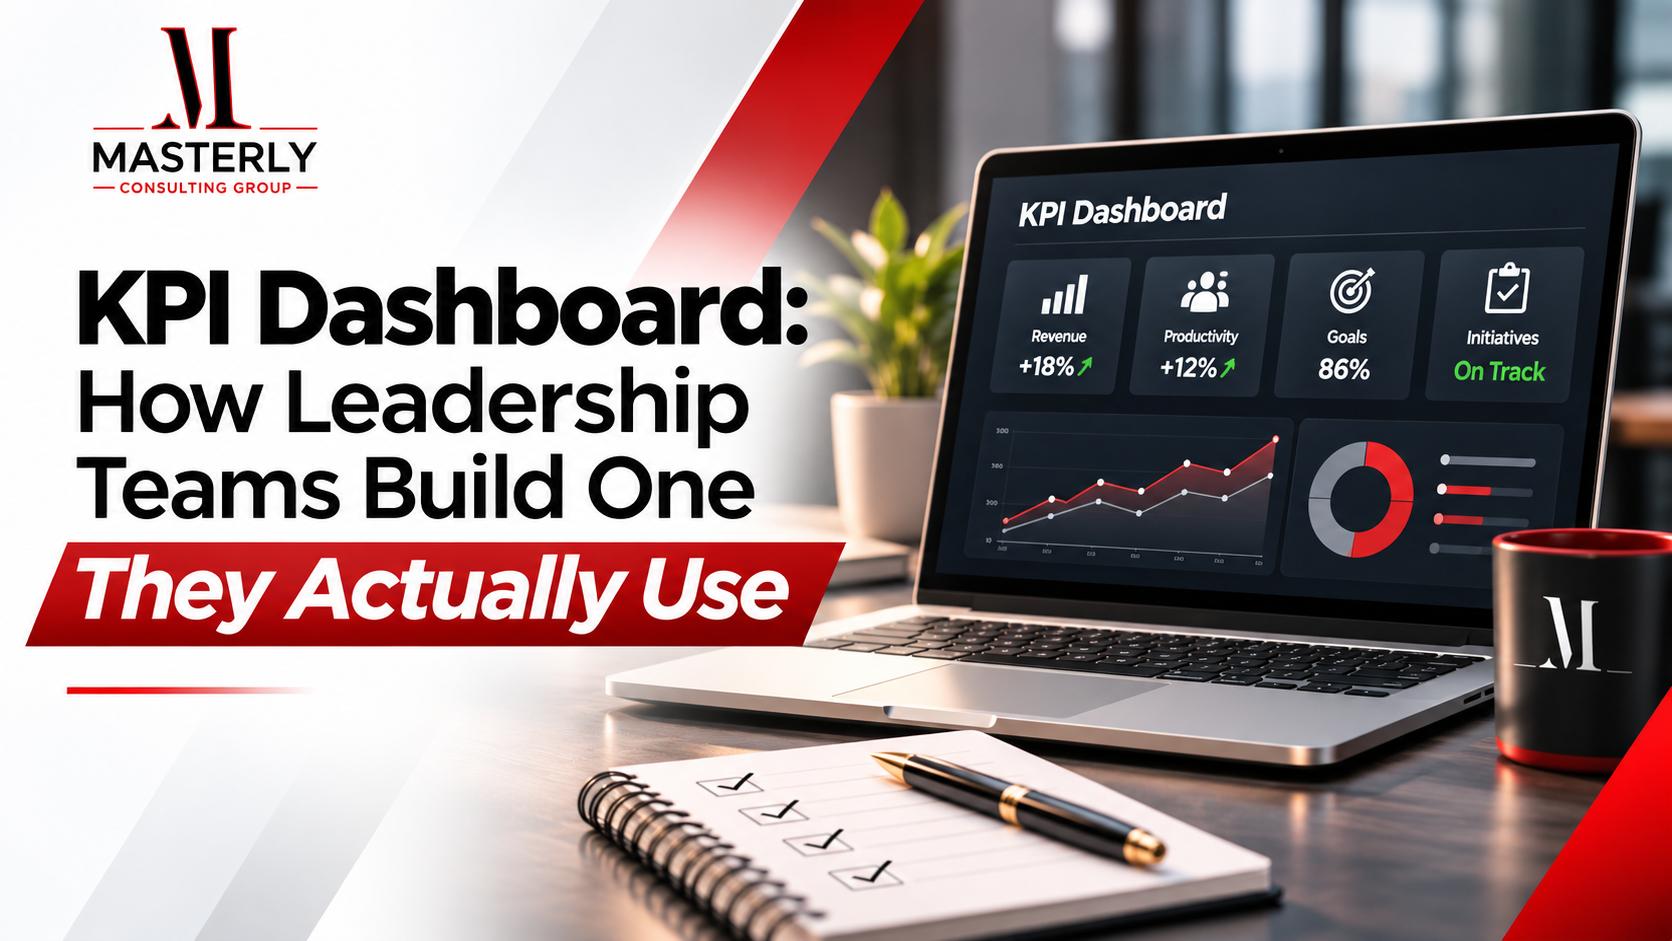
A small set of key measures, often shown on a scorecard or dashboard, tells the leadership team how the business is performing. Good scorecards mix leading indicators, such as pipeline, on-time delivery, or hiring progress, with lagging results like revenue and margin. Objectives and key results can sit in this layer; our OKR framework guide covers how to write them.
Operating Cadence
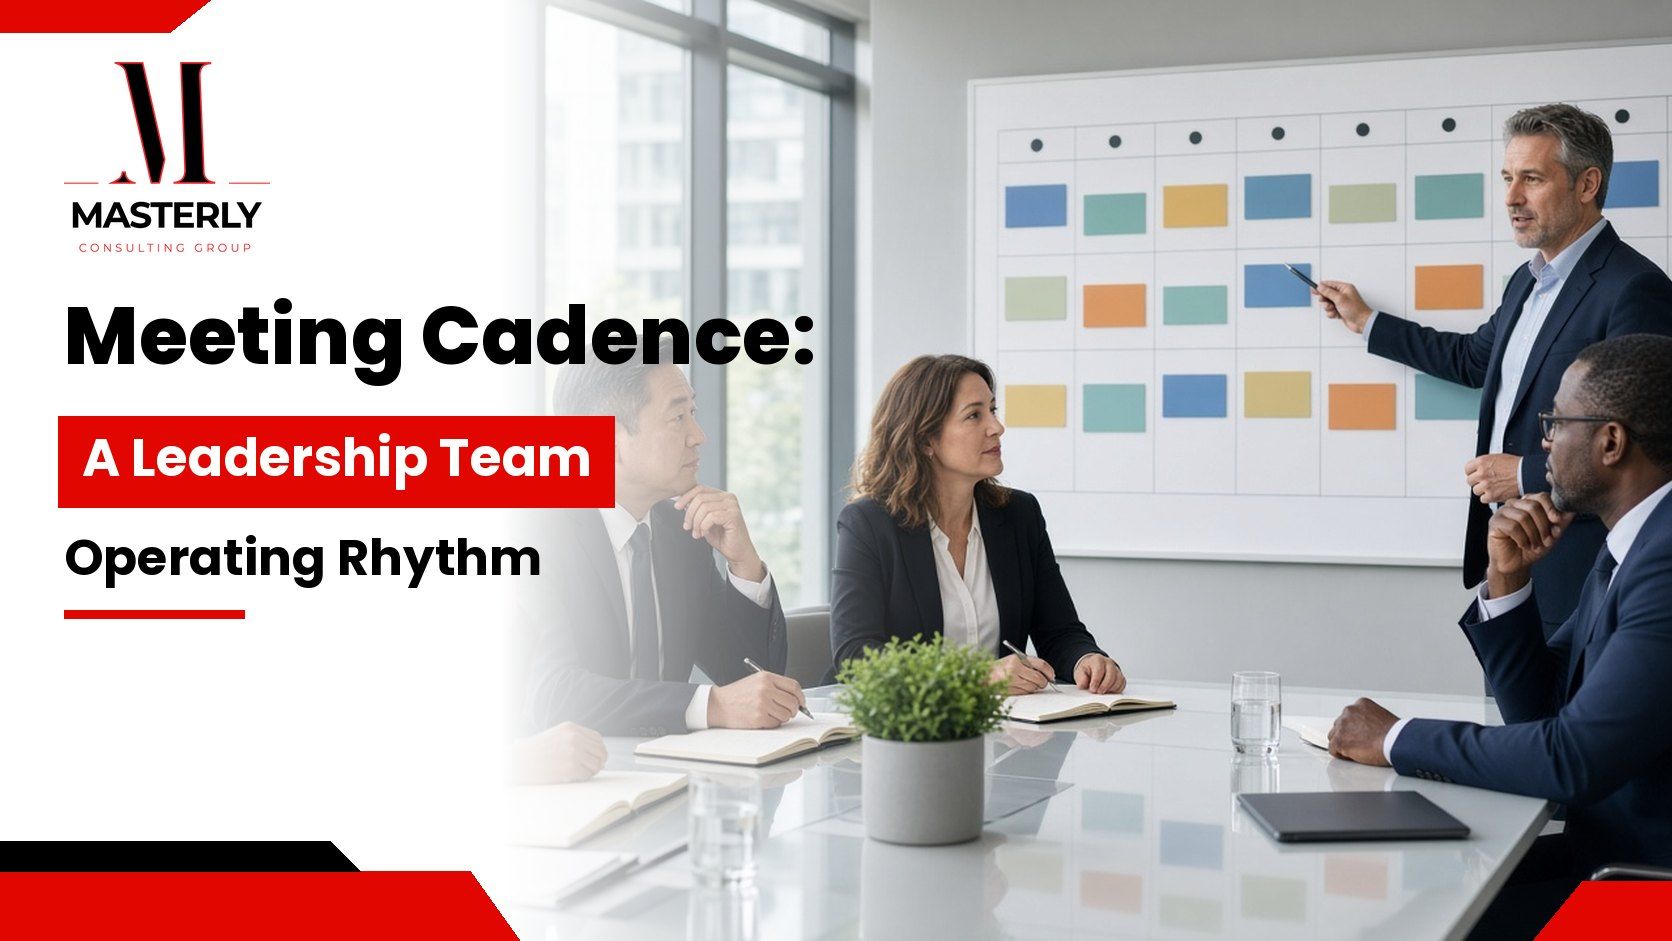
The operating cadence is the rhythm of recurring meetings and reviews in which the measures are discussed and decisions are made. It is the heartbeat of the management operating system. We cover this layer in depth in our guide to meeting cadence for leadership teams.
Problem Solving and Escalation
When a measure goes off track, the system needs a standard way to respond: who investigates, how root causes are identified, and when an issue is escalated to a more senior forum. Structured problem solving keeps the same issues from returning every month.
Roles and Accountability
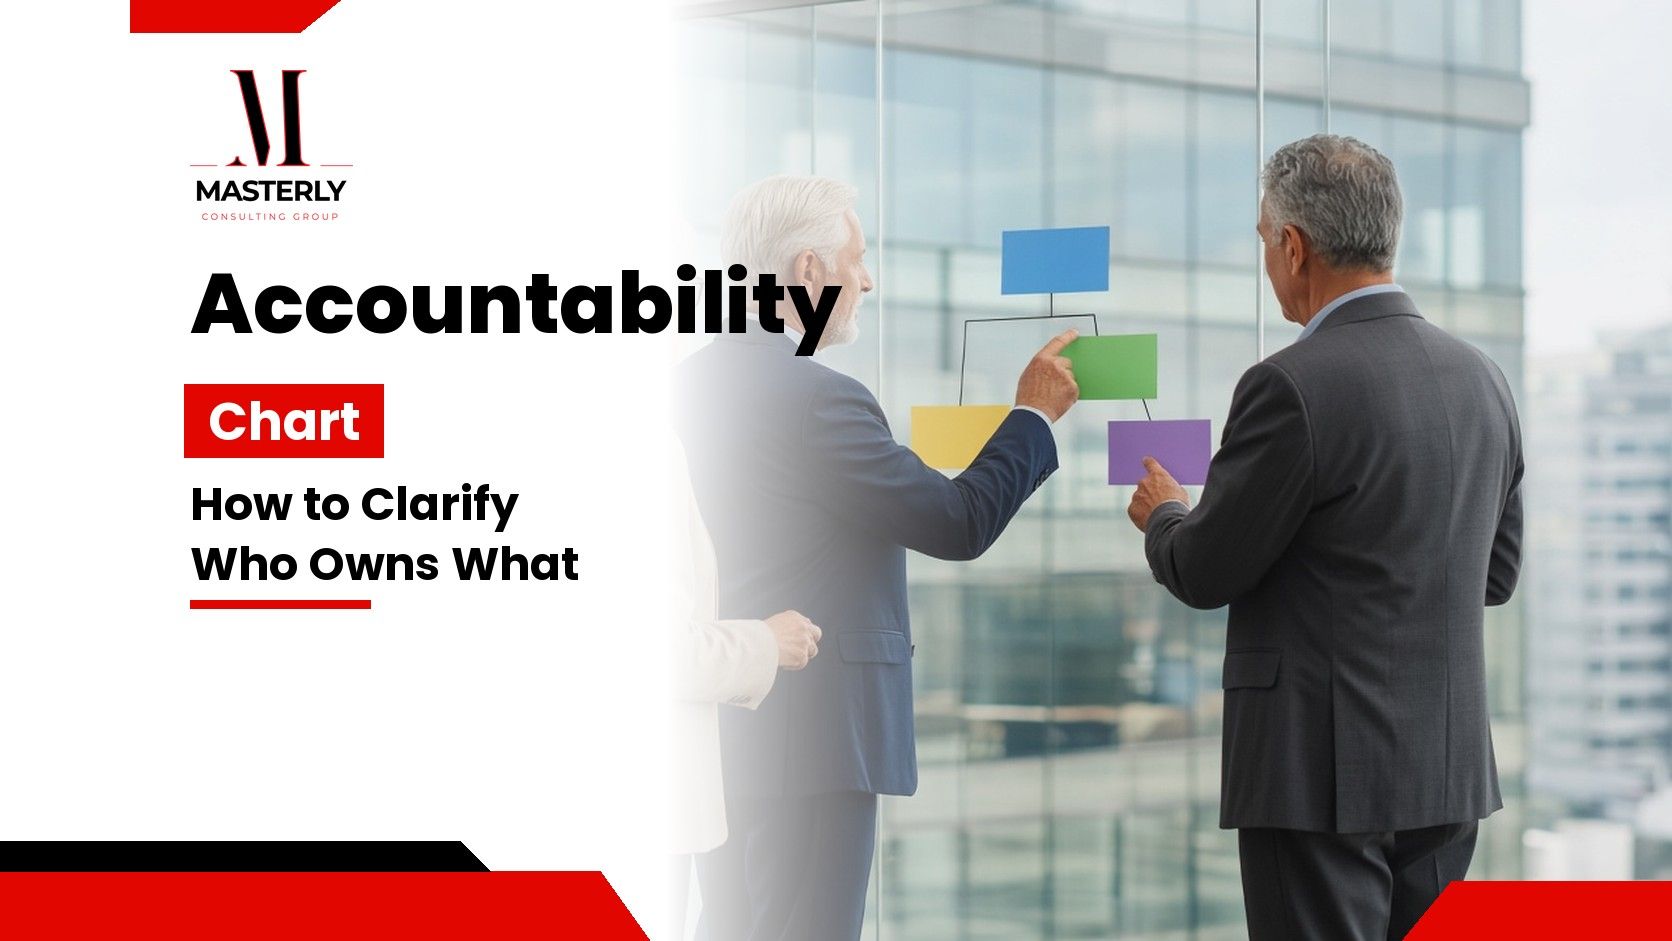
Each measure, priority, and meeting has a clear owner. Decision rights are explicit, so the team knows which decisions are made in which forum and by whom.
Coaching and Continuous Improvement
The best systems include regular coaching from leaders to managers, and a routine for reviewing the system itself. Leaders ask what is working, identify gaps, and adjust measures and meetings as the business changes.
What Is Operating Cadence?
Operating cadence is the schedule of recurring meetings, reviews, and reporting that a company uses to run its business. A typical operating cadence for a leadership team includes:
- Weekly: a leadership team meeting to review the scorecard, solve the most important problems, and make decisions that cannot wait.
- Monthly: a deeper performance review of results, forecasts, and resources.
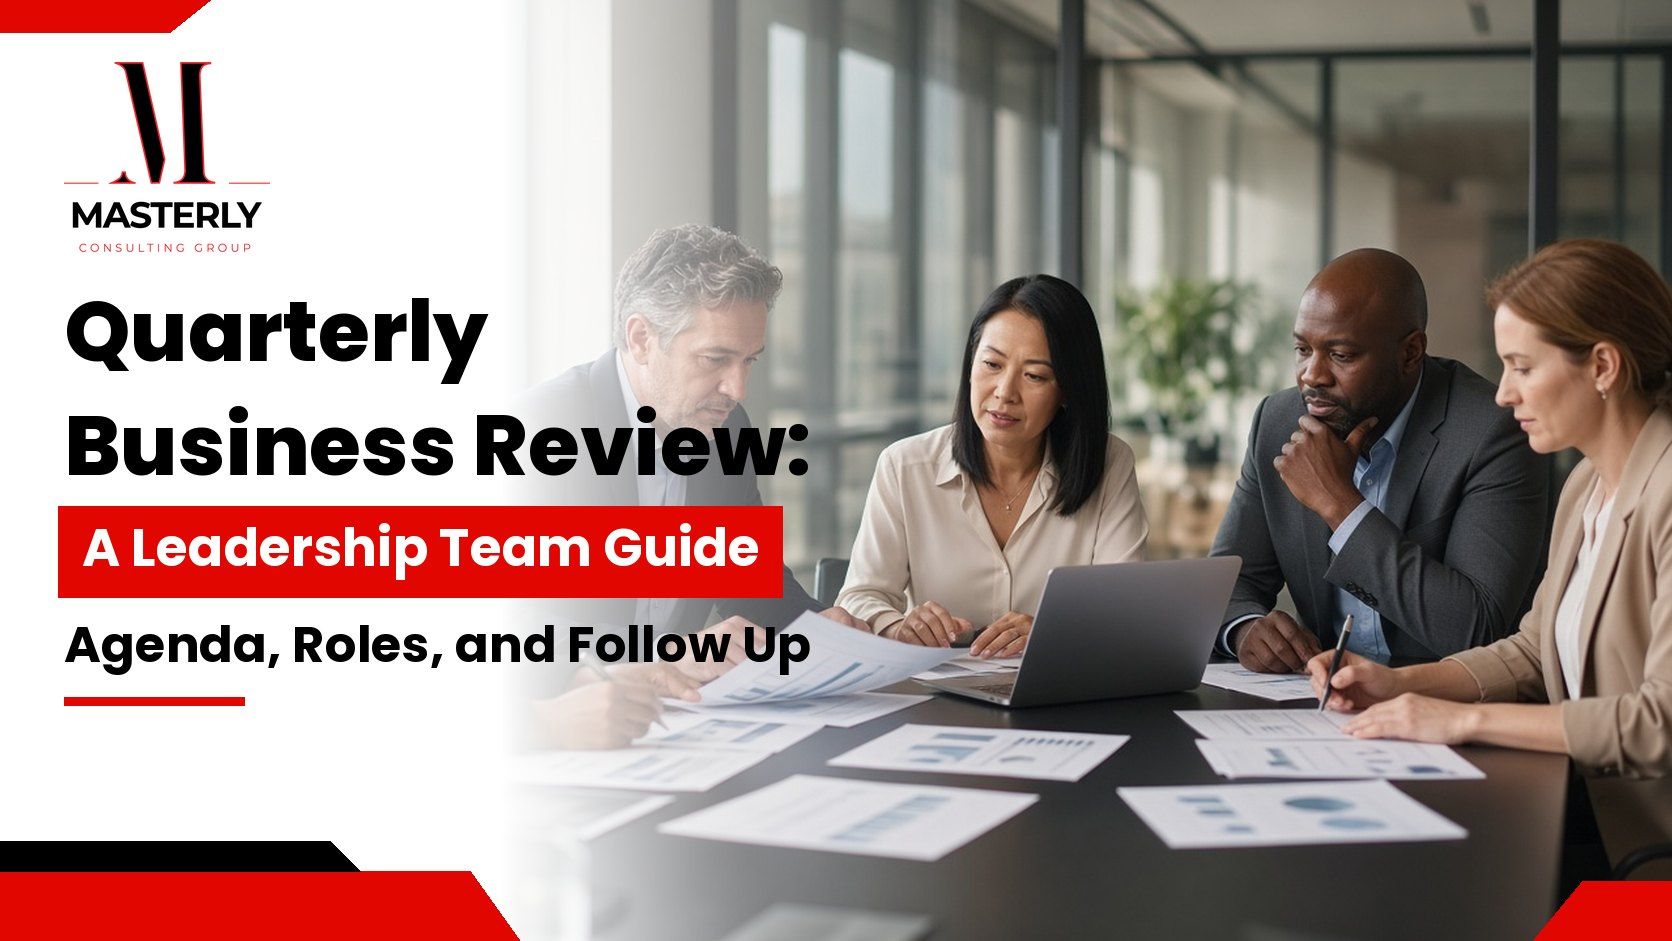
- Quarterly: a quarterly business review to check priorities and reset objectives.
- Annually: strategic planning and the annual operating plan.
Board meetings, if the company has a board, fit into the same rhythm. A well designed cadence makes sure information reaches each forum on time and that each meeting has a distinct purpose.
Operating Cadence for Sales Teams
Sales leaders often build their own cadence inside the company system: weekly pipeline reviews to advance deals, one-on-one coaching with each sales rep, and monthly or quarterly reviews of sales targets. The same principles apply. Each recurring meeting should have a clear purpose, the right data, and an owner.
How to Build a Management Operating System
You do not need to redesign everything at once. Start small and build the system in layers.
- Map what exists. List existing meetings, reports, and dashboards. Note the purpose, attendees, and time spent on each. Many organizations find overlapping meetings and reports nobody reads.
- Clarify priorities. Confirm the company's strategic goals for the year and quarter, with owners.
- Choose the measures. Pick a small set of key metrics for the company and each team. Fewer, better measures are easier to manage than long dashboards.
- Design the cadence. Decide which forum reviews which measures, how often, and with whom. Retire or merge meetings that do not have a clear purpose.
- Define problem solving. Agree how off-track measures are investigated and escalated, and how actions are tracked.
- Assign roles. Name owners for each meeting, measure, and priority, and clarify decision making rights.
- Pilot, then expand. Run the new system with the leadership team for one quarter, then extend it to the next level of management.
- Review the system. At each quarterly review, ask what to keep, change, or drop.
Common Mistakes
- Too many measures. A scorecard with fifty metrics hides the few that matter.
- Meetings without decisions. If a recurring meeting only shares updates, consider replacing it with a written report.
- No link to strategy. Measures and meetings that do not connect to the company's priorities create activity, not progress.
- Treating it as a project. A management operating system is never finished. It should continuously improve as the business grows.
- Copying another company's system. Frameworks are useful starting points, but the system has to fit your company's size, pace, and structure.
Frequently Asked Questions
What Is a Management Operating System?
A management operating system is the set of routines, measures, meetings, and roles a leadership team uses to set goals, track performance, solve problems, and make decisions.
What Is Operating Cadence?
Operating cadence is the recurring schedule of meetings, reviews, and reporting that a company uses to run the business, from weekly leadership meetings to quarterly reviews and annual planning.
Can You Give an Example of a Meeting Cadence?
A common leadership cadence is a weekly team meeting, a monthly performance review, a quarterly business review, and an annual planning session, each with a distinct purpose and set of measures.
What Does Cadence Mean in Business?
In business, cadence means the regular rhythm at which a company plans, reviews performance, and makes decisions.
How Long Does It Take to Build a Management Operating System?
A leadership team can design a first version in a few weeks and run it for a quarter before refining it. The system then improves through regular review.
Build a System That Runs the Business
If your leadership team spends too much time chasing updates and too little time making decisions, Masterly Consulting Group can help you design a management operating system that fits how your company works. Learn how our strategy execution support keeps priorities moving, or contact the firm to start with a review of your current meetings and measures.