
KPI Dashboard: How Leadership Teams Build One They Actually Use
Most leadership teams either drown in metrics or fly blind with none. The fix isn't more data. It's the right data, organized on a single page, reviewed every week, and tied to decisions that move the business forward.
This guide walks you through what a KPI dashboard is, how to choose the few metrics that matter, kpi dashboard examples by function, and how to use the dashboard in a weekly leadership review that actually changes outcomes.
What Is a KPI Dashboard?
A KPI dashboard is a visual reporting tool that displays the most critical key performance indicators on a single page, refreshed regularly, so leadership can answer two questions every week: "Are we on track?" and "Where do we need to act now?" KPIs are measurable values showing how effectively a business achieves its objectives. The dashboard transforms complex data into at-a-glance charts and metrics, giving leadership an instant health check against business targets.
An effective KPI dashboard does not show every metric available. It tracks selective metrics aligned with company goals, combining a small set of financial, customer, operational, and people measures tied directly to strategy. This article focuses specifically on an executive KPI dashboard for a leadership team-not the tactical or analytical dashboards that analysts or individual contributors use day to day.
Core traits of an executive KPI dashboard:
- One-page view that leadership can scan in minutes without scrolling.
- Weekly refresh cadence with frozen snapshots so the team debates the same numbers.
- Clear ownership where each metric has a named leader responsible for explaining it.
- Consistent, documented definitions so no one wastes meeting time arguing what "customer" or "pipeline" means.
Executive vs Operational KPI Dashboards
Different roles require different types of KPI dashboards. A CEO reviewing company health quarterly is not asking the same questions as a warehouse manager checking today's shipment accuracy. Building one dashboard for everyone guarantees it serves no one well.
Three levels, each with its own purpose:
- Executive dashboard (CEO dashboard): Monitors long-term company strategy and critical success factors. Weekly or monthly cadence. Answers: "Are we on target this quarter? Do we need to adjust hiring, pricing, or strategic bets?"
- Operational dashboard: Provides a snapshot of current conditions for daily monitoring. Used by managers running distribution, support, or manufacturing. Answers: "Is support response time meeting SLA today? Is the team meeting this week's targets?"
- Tactical dashboard: Tracks progress toward specific goals for individual contributors or project teams. Answers: "What lead activities should I prioritize to hit my monthly quota?"
Departmental dashboards are tailored for specific teams and their metrics, while analytical dashboards explore complex trends in large datasets for deeper investigation.
How they should visually differ:
- Executive dashboards use fewer charts, more trend lines, and large color-coded status indicators. No filters, no complexity.
- Operational dashboards show more real-time statuses, detailed breakdowns by team or process, and granular filters.
- Tactical dashboards focus on individual task lists and short-term targets.
Build the executive KPI dashboard first. Once leadership agrees on what matters and how to review it, spin off operational dashboards from that stable foundation.
Choosing the Few Metrics That Matter: Leading vs Lagging
The biggest mistake leaders make is trying to track everything. An effective KPI dashboard limits the executive view to 8–12 KPIs, with 4–8 of those receiving weekly attention. KPIs must be actionable to inform management decisions-if a number can't trigger a response, it doesn't belong on the leadership page.
Use the SMART framework to select effective KPIs: each one should be specific, measurable, achievable, relevant, and time-bound. KPIs should directly support strategic objectives, and you should review historical data to validate that selected KPIs actually predicted or explained outcomes in prior quarters.
Leaders need both leading and lagging indicators together for actionable insights:
- Lagging indicators measure outcomes already realized: revenue, churn, net income, gross margin. They tell you what happened.
- Leading indicators are early signals that predict those outcomes: pipeline created, demo volume, on-time delivery, hiring funnel velocity. They give you time to act.
Pair each result metric with one or two drivers:
- New ARR (lagging) → Sales-qualified pipeline and win rate (leading)
- Gross margin % (lagging) → Utilization % and average bill rate (leading)
- Customer retention (lagging) → Product usage depth and renewal conversations started (leading)
A simple 3-step process to prune metrics:
- Inventory everything currently tracked across reports and dashboards.
- Mark which metrics triggered meaningful decisions last quarter.
- Cut everything else from the executive KPI dashboard. Those numbers can still live in departmental views.
KPI Dashboard Examples by Function
These are example KPI sets that belong on a business KPI dashboard at the executive level-enough to monitor business performance effectively without turning into a deep departmental scorecard. A KPI dashboard should include relevant KPIs tied to specific business goals, and you should group related metrics logically for better understanding. Different visualizations are needed for varying types of KPIs.
Sales
- New ARR or MRR (revenue growth trajectory)
- Pipeline coverage ratio (typically 3–4× target)
- Win rate %
- Average deal cycle time
- Net or gross churn and retention, shown as 12–18 month trend lines with weekly or monthly granularity
Marketing
- Sourced pipeline attributed to marketing
- Cost per opportunity
- Blended customer acquisition cost
- Channel-level CAC: paid search, paid social, events, ad spend efficiency
- Lead-to-opportunity conversion rates
Operations
- On-time delivery %
- Backlog or order book size
- Cycle time
- NPS, CSAT, or customer satisfaction score
- Quality or defect rates, chosen based on business model (SaaS vs manufacturing vs services)
Finance
- Revenue (ARR/MRR) vs target
- Gross margin and operating margin
- Cash balance and cash runway with projected end date
- Next-quarter forecast shown visually alongside historical data
People/HR
- Total headcount vs plan
- Revenue per FTE
- Voluntary turnover rate and customers lost to attrition-related service gaps
- Time to fill critical roles
- Employee engagement or eNPS
On the executive view, include only the people metrics that signal strategic risk-turnover, headcount vs plan, and revenue per FTE. Everything else lives on a dedicated people dashboard.
Designing the CEO Dashboard Specifically
The CEO dashboard zooms into the vital signs that determine whether the company is healthy, growing, and funded. KPI dashboards help businesses monitor, measure, and analyze performance at the highest level. Effective KPI dashboards pair goal-aligned metrics with clean visual hierarchy, highlighting the most important indicator of success clearly.
Top-row vital signs (3–4 large tiles with red/amber/green status):
- Revenue vs target
- Cash runway in months
- Net revenue retention %
- Operating margin
Below the vital signs, the CEO dashboard should include:
- Pipeline health and new customers acquired
- One or two strategic initiative trackers (e.g., new product launch progress, international expansion milestones, M&A pipeline)
- Board-level metrics like burn multiple or profitability trend
Each metric pairs with its time dimension-this week, month-to-date, trailing twelve months-and a target. The CEO should never have to ask "Is this good or bad?" Visual indicators on KPI dashboards help measure progress against targets instantly.
Design guidance:
- Big-number tiles for vital signs at the top
- Trend lines for trajectory metrics in the middle row
- Drill-down capabilities in KPI dashboards allow inspection of underlying data, but keep these off the main view-accessible with a click, not cluttering the page
- Minimal filters (by region or product only if they serve decision making)
- No dense tables or micro-level detail
Layout, Owners, and Data Sources
A useful KPI dashboard is equal parts design, ownership, and data plumbing. One person owns the number. A different person may own the data pipeline. Both matter, but the metric owner carries accountability for explaining what the number means and what to do about it.
Layout:
- Single page that fits on a laptop screen without scrolling
- Grouped into 3–4 rows: Financial (top left), Customers/Sales, Operations, People
- Visual hierarchy with the most critical KPIs in the top-left position, where the eye lands first
- Consistent color semantics: green, amber, red for statuses, with thresholds explicitly shown
- KPI dashboards can identify trends and bottlenecks in data when the layout guides the eye naturally
Owners:
- Assign one named owner per KPI: VP Sales for new ARR, CFO for cash runway, Head of People for voluntary turnover
- That owner explains variances and proposes actions in weekly meetings
- Sharing KPI dashboards helps align teams around accountability-when everyone sees the same numbers, ownership becomes visible
Data sources:
- KPI dashboards connect to various business tools for a unified view: CRM (Salesforce, HubSpot), billing systems, ERP or accounting system (QuickBooks, NetSuite), HRIS, support platforms
- Consistent definitions across systems are non-negotiable. Document each metric's formula, scope, and filters in a simple legend or side panel
- Establishing a refresh schedule for data in KPI dashboards ensures data accuracy
Update cadence:
- Automated data updates in KPI dashboards allow real-time performance monitoring for operational areas
- For the executive view, use a weekly "frozen" snapshot so everyone debates the same numbers in leadership meetings
Building the KPI Dashboard: From Spreadsheet to BI Tool
Leadership behavior matters more than software. The tool you use is less important than how your executive team uses the dashboard to track KPIs, make decisions, and hold each other accountable.
Stage 1 - Spreadsheet:
- Excel is a preferred tool for KPI dashboards when starting out. Build a one-tab executive view linked to raw data tabs in a new sheet behind it.
- Use basic charts and conditional formatting to highlight KPI status (green/amber/red).
- Good for early alignment, testing definitions, and getting leadership comfortable with a consistent format.
- Templates can accelerate the first version.
Stage 2 - Simple BI tool:
- Replicate the same layout in a lightweight business intelligence tool that connects directly to source systems.
- Platforms like Microsoft Power BI and Tableau are commonly used for KPI dashboards. Dashboards automate reporting processes to save time and increase efficiency.
- KPI dashboards should update automatically with new data, reducing manual overhead.
- Visualize KPIs using charts and graphs for better insights.
Stage 3 - Centralized data model:
- When the company grows past roughly 200 employees, operates in multiple regions, or runs several product lines, invest in a data warehouse.
- Keep the executive KPI dashboard simple despite complexity underneath. The CEO should still see one page with robust features hidden below.
Using the Dashboard in a Weekly Leadership Review
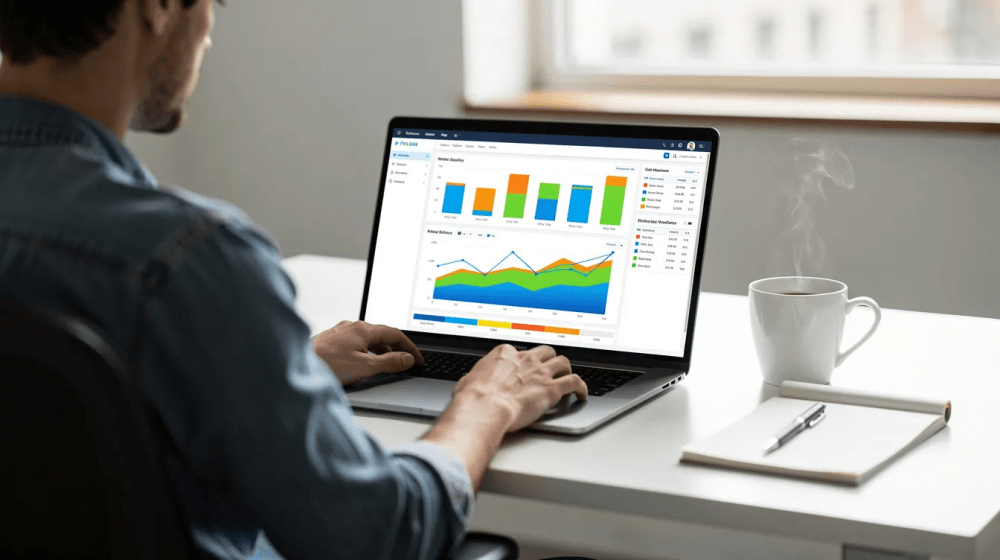
The primary purpose of an executive KPI dashboard is to anchor a recurring leadership meeting-typically 60–90 minutes weekly-where the executive team evaluates business performance and decides what to change. Without this rhythm, visual dashboards become decoration. An effective KPI dashboard turns raw business data into clear decisions.
Concrete meeting agenda:
- 10 minutes: Scan the full dashboard. Which KPIs are on target? Which are deviating? This rapid scan helps decision makers quickly understand where to focus.
- 10–15 minutes: Wins and risks. What's going well? What could go wrong? KPI dashboards help identify problems early in business performance.
- 20–30 minutes: Deep dive into off-track KPIs. Each owner provides a short narrative: status vs target, what changed since last week, proposed actions. KPI tracking becomes meaningful only when it drives conversation.
- Remaining time: Set decisions, assign owners, and capture action items.
Meeting norms that make this work:
- Screen-share the dashboard so everyone looks at the same view
- No debating the data in the meeting-definitions should be agreed in advance
- Review the same KPIs every week to build rhythm; track trends over time rather than reacting to single data points
- Capture decisions alongside the dashboard in a notes panel, linked document, or action log
- Dashboards improve decision-making through accurate and timely information, but only if the meeting enforces follow-through
The dashboard exists to inform decisions and drive smarter decisions, not to generate passive reports that sit in inboxes.
Keeping Your KPI Dashboard Accurate and Current
Manual dashboards tend to decay by month three. Leadership trust drops when data is missing, stale, or when definitions change without notice. Data accuracy is the foundation-without it, your dashboard becomes shelf-ware. Dashboards must be updated regularly to maintain trust.
Practices that maintain trust:
- Automate data collection and refreshes where possible. If decisions happen weekly, data should update at least daily.
- Run quarterly audits of key data sources to double check consistency: query joins, definition changes, cleaning anomalies.
- Maintain a "data issue" log where team members flag anomalies when new data looks suspicious.
- Document each KPI once: formula, data source, owner, refresh cadence, and date of last definition change. This ensures future hires and board members can quickly understand exactly what the number represents.
- Run a monthly "dashboard retro" to remove obsolete metrics, refine visualizations, and confirm the dashboard still reflects current strategy and the ever changing needs of the business as it grows.
Identifying business trends is a key use of KPI dashboards, but only when the underlying data is clean, consistent, and current.
Common Mistakes When Leaders Build KPI Dashboards
These are the errors that turn a promising dashboard into a cluttered dashboard nobody opens.
- Tracking 30–40 numbers on one page. A KPI dashboard can include 8 to 12 key metrics for clarity. If a metric didn't drive a decision last quarter, move it off the executive view.
- Changing KPIs every few weeks. This causes drift and confusion. Lock KPIs quarterly, aligned to strategic goals. Change only when strategy shifts.
- Tracking vanity or activity metrics. A sales team measuring call volume instead of pipeline health and win rate sees activity but not revenue trajectory. Ensure leading metrics are predictive and paired with outcome metrics.
- Hiding metric definitions. If two leaders define "customer" differently, the meeting devolves into arguments. Document definitions visibly-on the dashboard itself or in a linked metric dictionary.
- Building dashboards nobody reviews live. A dashboard that isn't used in a meeting cadence is just a report nobody reads. Set a weekly review that leadership must attend.
- Overweighting lagging metrics. Tracking cash balance without cash runway means you see liquidity but can't project risk. Pair each lagging indicator with a leading one. KPI dashboards can reveal trends and performance shifts over time, but only if you include the right mix.
- Ignoring interactive filters for context. Interactive filters in KPI dashboards allow users to explore data categories (by region, product, segment) without adding clutter to the main view. Use them sparingly but intentionally.
FAQs About KPI Dashboards for Leadership Teams
Concise answers to the questions leaders ask most when first rolling out an executive KPI dashboard.
How many KPIs should a dashboard show? Limit executive dashboards to 8–12 KPIs. Of those, 4–8 should receive focused weekly attention. More than that dilutes focus, and leadership ends up scanning numbers without acting on any of them. KPI dashboards should provide simple, consumable insights-not exhaustive analysis.
What is the difference between a KPI dashboard and a report? A dashboard provides an always-on, visual representation for decisions-you open it and immediately see where you stand. A report is deeper, periodic, and retrospective, often used for board packets, audits, or long-form analysis. Dashboards draw attention to what needs action now. Reports explain what happened and why.
Who should own each KPI? Functional leaders own the KPIs tied to their domain: VP Sales for pipeline and ARR, CFO for cash and profitability, COO for operational KPIs, Head of People for turnover and engagement. The owner manages both performance and interpretation. Data engineers may maintain the pipeline, but they don't own the metric's business meaning. A KPI dashboard helps ensure accountability across teams within an organization. KPI dashboards also help in measuring employee and department performance when ownership is clear.
Should every department have its own dashboard? Yes, but separate from the executive view. Functional dashboards go deeper into marketing KPIs, financial KPIs, or support metrics. The executive KPI dashboard only includes metrics that relate to strategy and risk. KPI dashboards can be customized for different audiences and purposes.
How often should we change our KPIs? Usually quarterly. Review KPIs alongside strategic planning cycles. Avoid shifting metrics more frequently than the cadence at which you confirm strategy. The right KPIs for this quarter may not be the right KPIs next quarter, but constant change undermines the ability to track progress and long term targets.
From Dashboard to Action: Next Steps for Your Leadership Team
A KPI dashboard is only valuable if it shapes weekly decisions, reallocates resources, and prompts specific experiments or fixes when numbers move. Effective KPI dashboards can drive data-driven decisions in organizations-but only when leadership commits to using them, not just building them. KPI dashboards require reliable data sources and regular updates to deliver on that promise and support future success.
A 30-day plan to get started:
- Week 1: Define company priorities and risk areas. Select 8–12 candidate KPIs using the SMART criteria. Assign metric owners. Document definitions and thresholds. Identify KPIs that directly support strategic objectives.
- Week 2: Build a first-draft dashboard using existing data sources-a spreadsheet or BI tool. Get feedback from the executive team. Focus on making it fit one page.
- Week 3: Pilot the dashboard in leadership meetings. Use it as the central artifact. Note where gaps, confusion, or missing data show up. This is where monitoring becomes habit.
- Week 4: Refine based on feedback. Lock in the review cadence. Ensure data sources and refreshes are reliable. Roll out the defined dashboard across leadership. The goal is an analysis rhythm, not a perfect tool.
Align your KPI dashboard with your existing goal framework-whether that's OKRs or a balanced scorecard-so every KPI ties back to a strategic objective.
Ready to build a dashboard your leadership team will actually use? Schedule a consultation with Masterly Consulting Group to review your existing metrics, design an executive dashboard aligned to strategy, and establish a weekly review cadence that turns data driven decisions into a habit, not an aspiration.