
Accountability Chart: How to Clarify Who Owns What
An accountability chart shows the major functions a business needs, the outcomes each role owns, and the person ultimately accountable for each one. Unlike a traditional org chart, which mainly shows reporting lines, it makes responsibility visible. Build the structure around the work the company needs done, then assign people to the right seats.
This guide explains the EOS Accountability Chart, how it differs from an org chart or RACI, and a practical way to clarify responsibilities without turning the exercise into a debate about titles.

What Is an Accountability Chart?
The Accountability Chart is a tool associated with the Entrepreneurial Operating System (EOS). EOS Worldwide's own explanation starts with the structure the business needs, rather than the people it employs today. Each seat has defined major roles and one person who is ultimately accountable for it.
That order matters. If leaders start by drawing boxes around today's names, the result often protects existing jobs rather than solving the work problem. A growing company might need a clear owner for client delivery even when two people currently share the tasks. The chart should first show the function, then make it clear exactly who owns the result.
An accountability chart is a visual tool, not a replacement for job descriptions, performance conversations, or a workable operating model. It gives those other systems a clearer starting point.
How Is It Different From an Org Chart?
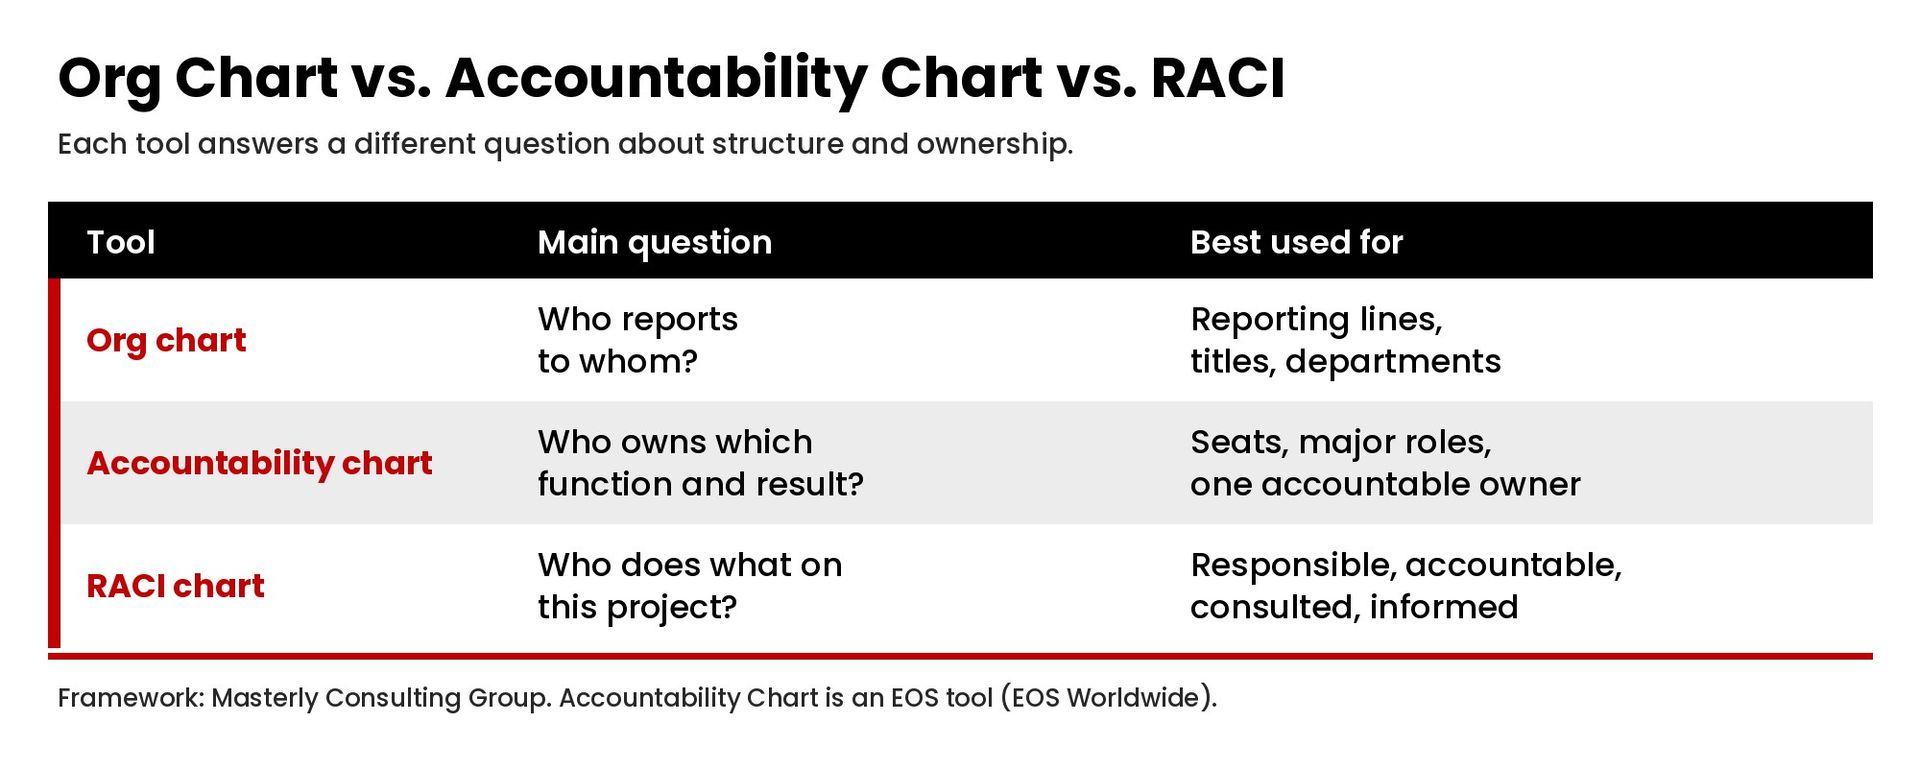
A traditional org chart answers "Who reports to whom?" An accountability chart answers "Who owns what?" Both can show a hierarchy, but the purpose differs.
- Org chart: reporting lines, titles, departments, and management relationships.
- Accountability chart: essential functions, specific roles, major responsibilities, and a single accountable person for each seat.
- RACI chart: responsibilities for a particular project or process, including who is responsible, accountable, consulted, and informed.
Use the tools together when needed. The org chart can show a finance manager reporting to an operations leader. The accountability chart should make the finance manager's outcomes explicit. A RACI can then explain that person's role in a particular pricing decision. See our guide to a RACI chart for that project-level distinction.
What Functions Belong on the Chart?
EOS Worldwide describes Visionary and Integrator seats at the leadership team level, with three major functions: Sales and Marketing, Operations, and Finance and Administration. Those are EOS terms, not titles every company must adopt.
The useful question is what work your business actually needs someone to own. For a professional-services firm, the functions might include:
- Sales and marketing: qualified opportunities, the marketing strategy, proposals, and the sales process.
- Operations: delivery capacity, quality, client handoffs, and service consistency.
- Finance and administration: billing, cash visibility, reporting, and administrative systems.
Under each major function, define roles around outcomes rather than a long task list. "Own the client onboarding process" is clearer than "help with new clients." The first has an accountable result. The second can leave two people believing the other person is responsible.
How Do You Build an Accountability Chart?
1. Draw the structure before adding names
Describe the functions the company needs for the next stage of its work. EOS recommends thinking about the next six to 12 months. Keep that planning horizon separate from promises about growth or hiring. A box on the chart is not an approved job opening.
2. Define the major responsibilities of each seat
Write a short list of the outcomes each seat owns. Avoid vague words such as "support" unless the chart also identifies who is accountable for the final result. Ask whether an employee could explain the role to a colleague without a second conversation.
3. Check for overlap and missing work
Walk one real customer request through the structure. Who accepts it? Who decides scope? Who delivers it? Who handles a problem? A chart that looks balanced but leaves these handoffs unclear has not finished its job.
4. Assign people to seats
Only after the structure is clear should the leadership team add names. EOS describes the fit as Right People, Right Seats: people who fit the organization's core values and who get the role, want it, and have the capacity to do it. Attribute that framework to EOS rather than presenting it as a Masterly method.
5. Test the chart against decisions
Use current work to test whether the responsibilities hold. If a client requests an exception, the team should know who can approve it. If a deadline is at risk, the owner should know when and where to raise the issue. Update the chart when those tests expose confusion.
What Should the Leadership Team Check Before Sharing It?
Do not introduce the chart as a finished verdict on people. Invite each department head to comment on the responsibilities and the decisions they can actually make. That conversation can expose a critical gap between accountability on paper and authority in practice.
Check whether the structure supports customers, shared goals, and alignment across teams. The visionary seat, in EOS terminology, is not simply a more impressive title for the person in charge. Define what the role owns before assigning it. A clear chart can reduce overlap, but a diagram alone will not eliminate confusion or create efficiency.
Explain what is changing, what is not, and where employees can raise questions without fear. Defining roles carefully is more useful than more memos, slogans, or internal posts about accountability while the same work remains unowned. Most teams need a short explanation and a chance to test the structure against a real request. The chart should help people see where they belong and how their work connects, not make them guess what the boxes mean.
Can One Person Hold Multiple Seats?
Yes. A small business may have one person filling multiple seats. Separate the functions on the chart even when one name appears more than once. That makes workload and future staffing decisions easier to see.
The important distinction is between one person in multiple seats and two people jointly accountable for one seat. The first can be a temporary structure. The second often makes accountability unclear. Shared goals are useful, but they do not remove the need for an owner who can make decisions and report on progress.
Do not use the chart to pretend the team has more capacity than it does. When one leader owns sales, delivery, and finance, that is a capacity constraint, not three fully staffed departments.
What Mistakes Create More Confusion?
- Starting with personalities. Build the work structure first, then discuss fit with respect.
- Listing every task. A crowded diagram hides the major responsibilities it is meant to clarify.
- Assigning ownership without authority. People need decision rights, information, and resources appropriate to the outcomes they own.
- Leaving it in a slide deck. Use the chart during planning, handoffs, onboarding, and leadership reviews.
- Treating it as a performance verdict. A structure conversation is not a substitute for a fair, specific performance discussion.
The point is clarity, not control for its own sake. A useful chart helps employees understand their contribution and helps leaders see where the organization needs a better process.
Put the Chart Into the Operating Rhythm
Bring unresolved ownership questions into the regular leadership meeting cadence. Review the chart when a role changes, a new function is introduced, or work repeatedly falls between teams. It should support the operating model, not become a separate exercise.
If your leadership team needs a clearer view of responsibilities before changing the structure, contact Masterly Consulting Group to discuss the decisions and handoffs that need attention.
Frequently Asked Questions
Is an accountability chart the same as an organization chart?
No. An org chart emphasizes reporting relationships. An accountability chart makes the major responsibilities and accountable person for each seat explicit.
Is every accountability chart an EOS Accountability Chart?
No. The EOS Accountability Chart is a named EOS tool. Businesses also use other responsibility diagrams. Be clear about whether you are following EOS or using a more general structure.
How many responsibilities should a seat have?
Keep the list short enough that the owner and leadership team can explain the role clearly. Record major accountabilities, not every task performed during a week.
Does creating a seat mean hiring someone immediately?
No. The chart describes needed functions. One person may fill multiple seats while leaders evaluate capacity, priorities, and any future hiring decision.