
Decision Log: How to Track Key Decisions and Why They Matter
A decision log is a centralized record of the important decisions a team makes: what was decided, why, who decided, when, and what happens next. It gives project teams and leadership teams a clear record of past decisions, so the same debates do not repeat and new team members can understand the context behind the current plan.
Most organizations make dozens of decisions every week, and only a few are written down. This guide explains what a decision log is, what to include, how to build one in a simple template, and how to keep it updated regularly so it supports better decision making instead of becoming another document nobody opens.

What Is a Decision Log?
A decision log is a running document that records key decisions as they are made. Each entry captures the decision itself, the rationale, the decision makers, the date, the status, and any follow up actions. Over time, the log becomes a historical record of how a project or business reached its current state.
The idea is not new. In software, architect Michael Nygard proposed the architecture decision record in 2011, a short document with a title, context, decision, status, and consequences for each significant choice ( Michael Nygard, Documenting Architecture Decisions). The same structure works for any team. A business decision log simply applies it to strategy, operations, hiring, pricing, vendors, and project execution.
A decision log is different from an action log or a meeting minutes file. Minutes record what was discussed. An action log tracks tasks. A decision log records what was decided and why, so the decision record stays useful long after the meeting ends.
Why Do Teams Need a Decision Log?
Teams need a decision log because memory is unreliable and people change roles. Without a written record, teams revisit the same question months later, lose track of trade offs they already weighed, and repeat the same mistakes. A decision log helps in several practical ways:
- It prevents repeated debates. When a stakeholder asks why the team chose one vendor over another, the answer and the rationale are already documented.
- It speeds up onboarding. New team members can read past decisions and understand the context without scheduling a dozen catch-up meetings.
- It supports accountability. Each entry names the decision maker and the owner of the next steps, so follow-through does not depend on who remembers the meeting.
- It improves future decision making. Reviewing previous decisions shows which assumptions held and which did not, which makes it a valuable tool for knowledge management.
- It keeps stakeholders aligned. A shared log keeps executives, project managers, and teams working from the same information, which is essential for effective collaboration across functions.
Decision logs serve a second purpose as well: they slow teams down just enough to state the reasoning. Writing one or two sentences of rationale forces the decision makers to confirm they agree on what was actually decided.
What Should a Decision Log Include?
An effective decision log is short enough to maintain and detailed enough to provide context. These are the key elements most teams need for each entry:
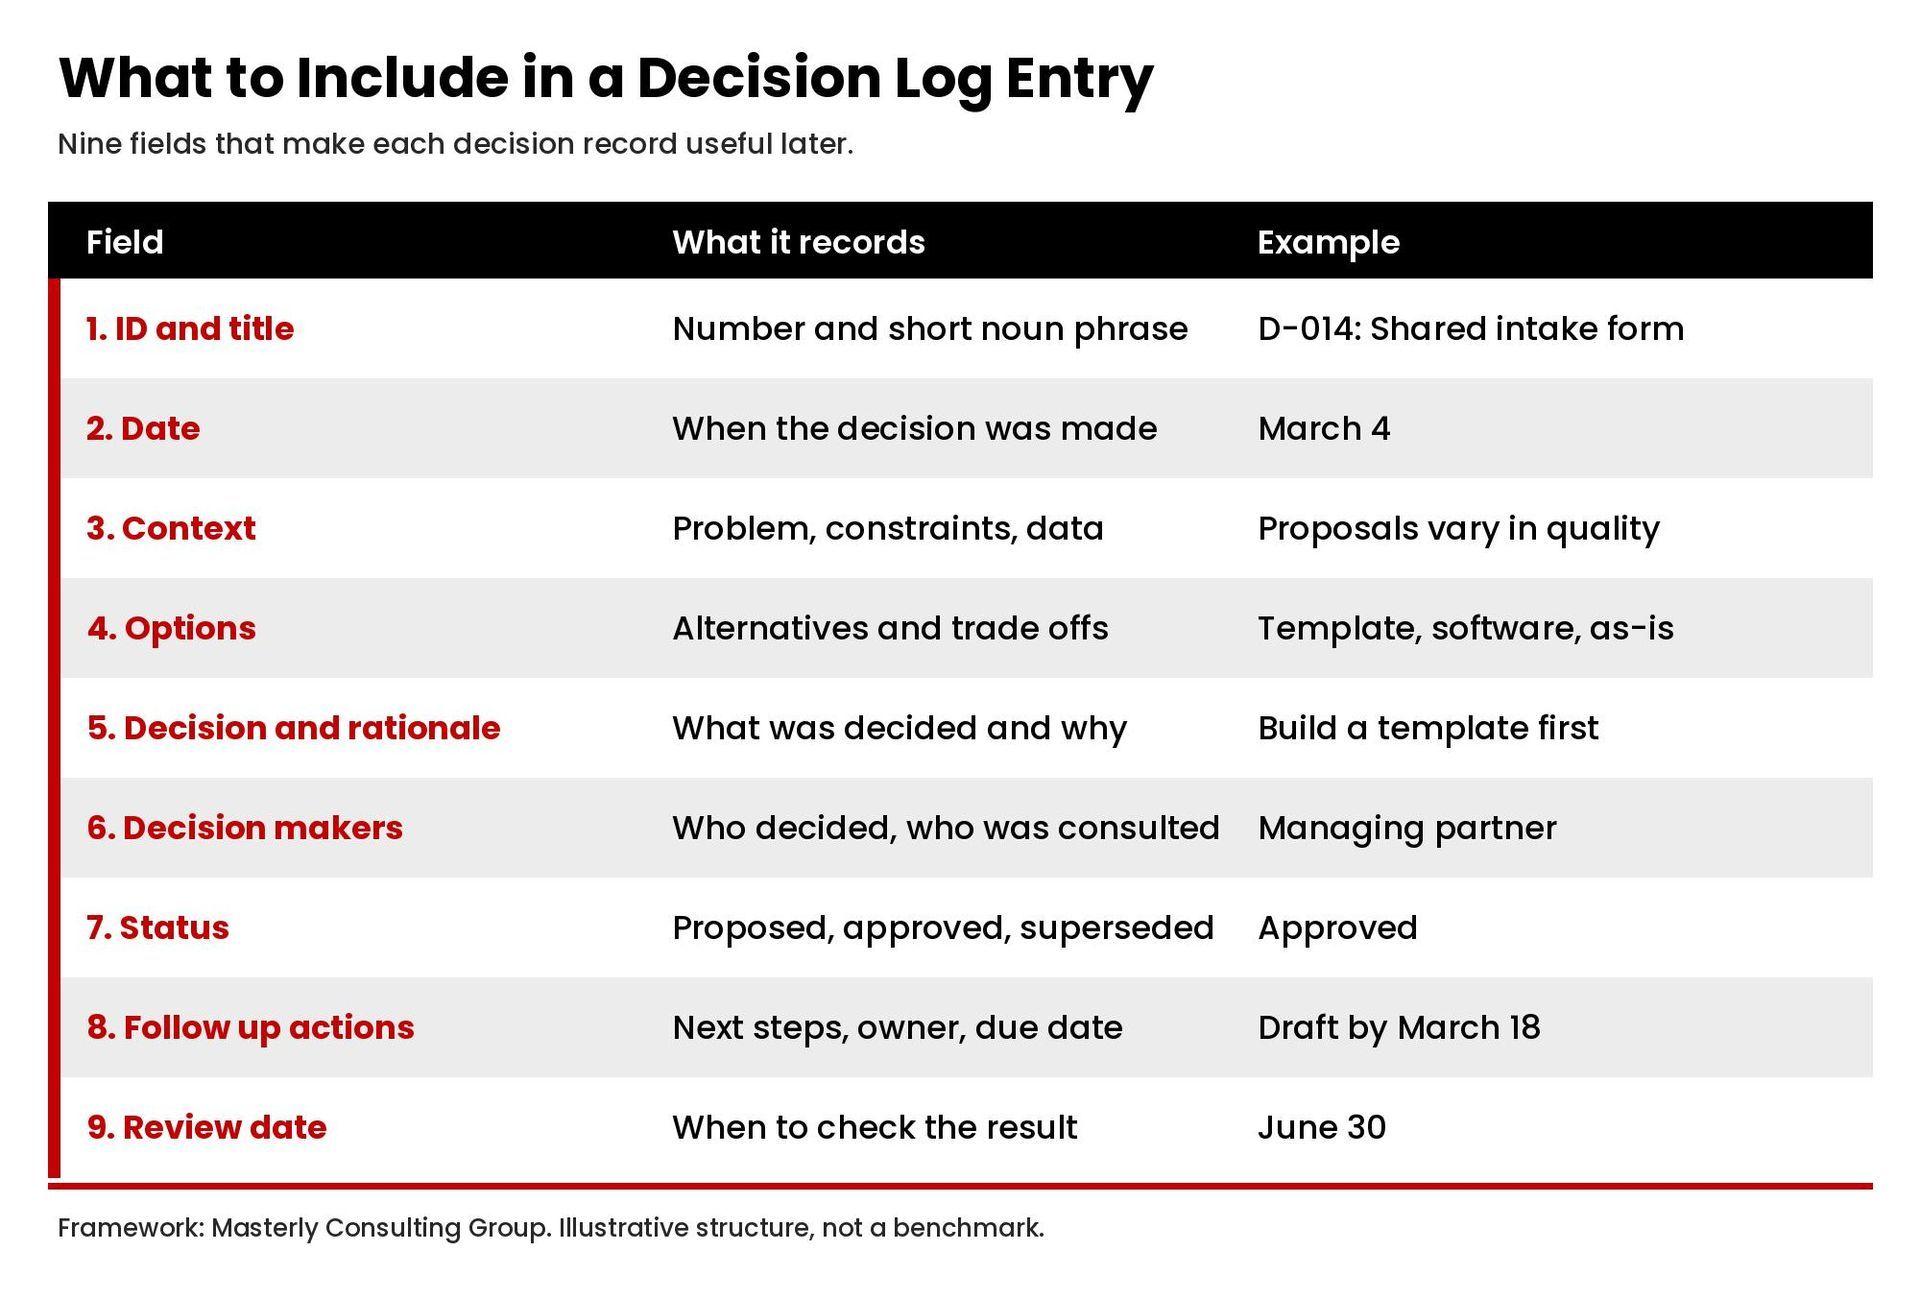
- Decision ID and title. A number and a short noun phrase, such as "D-014: Move client onboarding to a shared intake form."
- Date. When the decision was made, so the log reads as a timeline.
- Context. The problem, the constraints, and the relevant data. Two or three sentences are enough.
- Options considered. The alternatives and the main trade offs, so future readers see what was rejected and why.
- Decision and rationale. What the team decided and the reasons behind it.
- Decision makers and stakeholders. Who made the call, who was consulted, and who has a vested interest in the result.
- Status. Proposed, approved, superseded, or reversed. Nygard's format uses a similar status field and marks reversed decisions as superseded, with a reference to the replacement.
- Follow up actions and owner. The next steps, the person responsible, and a due date.
- Review date. When the team will check whether the decision is working.
Keep each decision record brief. A log that takes ten minutes per entry will not be maintained. A log that takes two minutes will.
How Do You Create a Decision Log?
Building a decision log takes less than an hour. Use this structured approach:
1. Choose one home for the log
Pick a single, centralized location the whole team can reach. A shared spreadsheet in Google Sheets, a table in Google Docs, a page in your work management software, or a database in your project management tool all work. Most project management tools and other tools teams already use can hold a decision log template, so there is rarely a reason to buy new software. What matters is that there is only one log per project or team, not several competing versions.
2. Build the template
Create columns or fields that match the key elements above. Start simple. You can add fields later if the team needs them, but a long form at the start discourages use.
3. Define which decisions belong in it
Not every choice needs an entry. Minor decisions, such as the time of a weekly call, can stay out. Set a simple rule: log any decision that affects scope, budget, timeline, customers, staffing, or another team's work, and any decision that would be expensive to reverse. Amazon founder Jeff Bezos described the distinction between reversible "two-way door" decisions that can use a lightweight process and decisions that deserve more care ( Amazon, 2016 Letter to Shareholders). Critical decisions that are hard to undo always belong in the log.
4. Assign an owner
Name one person, often the project manager or a chief of staff, who keeps the log current. Decision makers can add entries themselves, but one owner checks that each entry is complete.
5. Make it part of the meeting rhythm
Close every leadership or project meeting by confirming which decisions were made and adding them to the log before people leave. Our guide to meeting cadence for leadership teams explains where this fits in a weekly and monthly operating rhythm.
What Does a Decision Log Example Look Like?
Here is a decision log example for a growing professional services firm. It shows how one entry in the decision log template reads once it is complete:
- D-022: Standardize client proposals on one template. Date: March 4. Context: Proposals took four to six hours each and varied in quality across the team. Options considered: keep custom proposals, buy proposal software, or build an internal template. Decision: build an internal template in Google Docs this quarter and revisit software next year. Rationale: lowest cost, fastest to implement, and it gives the team data on what clients respond to before buying a tool. Decision makers: managing partner and operations director. Status: approved. Follow up actions: operations director drafts the template by March 18. Review date: June 30.
That single entry answers the questions a new team member would ask six months later. It also shows the trade offs, so if someone suggests buying proposal software, the team can see why it was deferred and whether the conditions have changed.
How Do You Use a Decision Log Template in Project Management?
A decision log template gives project teams a structured way to capture decision details without starting from a blank page. In project management, a project decision log usually sits beside the project plan, the schedule, and the RAID log, and project managers review it at every status meeting.
A practical decision log template for project execution has these columns: decision ID, decision title, date, context, options, decision, rationale, implications, decision makers, stakeholders informed, status, steps required, owner, and review date. If the project uses a project management tool, the same fields can become a form, so every new entry follows the same template and the decision documentation stays consistent.
Use the template in three moments during a project:
- At kickoff. Record the scope, budget, and approach decisions made during planning, so project teams start with a clear record of what was approved.
- During delivery. Add new decisions as changes come up, especially critical decisions that affect the timeline or other teams. Tracking decisions as they happen is easier than reconstructing them later.
- At closeout. Review the decisions made across the project and note key takeaways for future projects. This makes the log a single source of future reference for the next project manager.
Maintaining the log this way helps ensure alignment between project managers, team members, and stakeholders, and it supports efficient decision making because people can see what was already approved before they raise a question again. For larger programs, keep one decision log per project and a summary log at the portfolio level so leadership can see critical decisions across projects.
How Is a Decision Log Different From a RAID Log?
A RAID log tracks risks, assumptions, issues, and dependencies on a project. Some project managers include decisions as a fifth category, while others keep a separate decision log. Either approach can work. A separate log is often easier to read when a project has many decisions made over a long period, because decisions do not get buried among status updates on issues and risks.
A decision log also complements a decision framework. Tools such as Atlassian's DACI play, which assigns a Driver, Approver, Contributors, and Informed for each decision, help teams decide who makes a particular decision ( Atlassian Team Playbook, DACI). The decision log records the outcome. If your team needs a clearer method for reaching the decision itself, see our guide to the decision making process for leadership teams.
What Are Common Decision Log Mistakes?
Most decision logs fail for predictable reasons:
- Logging too much. Recording every minor choice turns the log into noise. Keep it to key decisions.
- Leaving out the rationale. A log that says only what was decided loses most of its value. The "why" is what helps future projects.
- No owner. Without one person keeping track, entries stop after a few weeks.
- Never reviewing it. Decisions made with incomplete data need a review date. Otherwise the team never learns which decisions worked.
- Hiding it. A decision log locked in one person's files cannot keep stakeholders aligned. Share it with everyone affected.
- Editing history. When a decision changes, add a new entry and mark the old one as superseded. Do not delete or rewrite past decisions, or the historical record loses its integrity.
How Does a Decision Log Support Accountability and Strategic Planning?
At the leadership level, a decision log connects strategic planning to execution. When the leadership team sets annual or quarterly priorities, the decisions behind those priorities, and the trade offs accepted, go in the log. During quarterly reviews, the team can check progress against the decisions that shaped the plan and update the status of each.
The log also supports accountability without blame. Because each entry records the information available at the time, a later review can separate a sound decision with a poor outcome from a poor decision. That distinction matters for building a culture where people are willing to make decisions. It pairs well with an after action review, which looks back at what happened after a project, and with an accountability chart that shows who owns each area of the business.
Frequently Asked Questions
What is the purpose of a decision log?
A decision log provides a centralized record of important decisions, including the rationale, decision makers, and next steps. It prevents repeated debates, helps new team members understand past decisions, and supports future decision making.
Who should maintain a decision log?
One owner, often a project manager, operations lead, or chief of staff, should keep the log current. Decision makers can add entries, but one person checks that each entry is complete and that follow up actions are tracked.
What is the difference between a decision log and an action log?
A decision log records what was decided and why. An action log tracks tasks and who will complete them. Many teams link the two, so each decision points to its follow up actions.
Can I use Google Sheets for a decision log?
Yes. A shared spreadsheet in Google Sheets or a table in Google Docs is a simple, effective decision log template for most small teams. Larger organizations often keep the log inside their project management or work management software.
How often should a decision log be updated?
Update the log whenever a key decision is made, ideally before the meeting ends. Review open entries at a regular cadence, such as monthly, and check each decision on its review date.
Make Better Decisions Easier to Find
A decision log is one of the simplest tools for keeping track of how a business makes choices, and its value grows with every entry. If your leadership team wants help building decision records, decision rights, and a review rhythm into how the company operates, contact Masterly Consulting Group to talk through where to start.