
Quarterly Business Review: A Guide for Leadership Teams
A quarterly business review (QBR) is a structured meeting, held once a quarter, where a leadership team compares results with the plan, decides what to change, and sets priorities for the next quarter. A good QBR ends with a short list of decisions, owners, and due dates, not just a slide deck that reports what already happened.
Most leadership teams already hold some kind of quarterly review. The problem is that many of these sessions turn into long status updates. This guide explains what a quarterly business review should cover, how to prepare for one, a sample QBR agenda, the roles in the room, and the mistakes that keep a QBR meeting from producing decisions.

What Is a Quarterly Business Review?
A quarterly business review is the leadership team's scheduled checkpoint between annual planning and weekly execution. It asks three questions: what happened in the past quarter, why it happened, and what the team will do differently in the upcoming quarter.
The term is used in two settings, and it helps to separate them:
- Internal QBRs focus on organizational performance. The leadership team reviews company or department results, key performance indicators, budget, people, and the plan for the year.
- Customer-facing QBRs , sometimes called executive business reviews, are run by account management or customer success teams with a client. They review the value delivered, usage data, customer feedback, and goals for the next quarter, and they help avoid surprises at renewal time.
This article focuses on the internal QBR for leadership teams. The customer version follows the same discipline: start from the other party's goals, show results with relevant data, and end with agreed next steps.
Where the QBR Fits in the Operating Rhythm
A QBR is one layer of a broader meeting cadence for leadership teams. Weekly meetings handle immediate decisions. Monthly reviews track trends and resource calls. The quarterly business review steps back to ask whether the current priorities are still right, and annual planning sets the direction the QBR measures against.
If the quarterly review is the only time the team looks at results, the meeting gets overloaded. If weekly and monthly forums are working, the QBR can stay focused on the few issues that need senior leadership.
Why Leadership Teams Run QBRs
A well-run QBR gives a company a regular, predictable moment to change course. Without it, priorities drift, and important decisions wait for the annual plan or get made in hallway conversations.
The main benefits are practical:
- Accountability: Each leader reports results against the targets set at the start of the quarter, so misses are visible early.
- Alignment: The whole leadership team hears the same picture of the business, which keeps teams aligned on what matters most.
- Course correction: A quarter is long enough to show a trend and short enough to recover. Three months is a reasonable unit for resetting objectives.
- Resource decisions: Budget approval, hiring, and project funding can be adjusted while there is still time in the year.
- Learning: A structured look at lessons learned helps the team repeat what worked and stop what did not.
Many companies connect the QBR to their goal system. If you use objectives and key results, the QBR is where the team scores the past quarter's OKRs and sets the next set. See our OKR framework guide for how those goals are written.
What Should Be Included in a QBR?
The content of a QBR should follow the plan the team committed to. A typical internal quarterly business review includes:
Executive Summary
Open with a one-page summary: the headline result, the biggest win, the biggest miss, and the two or three decisions the team needs to make today. Senior leadership should be able to understand the state of the business from this page alone.
Performance Against Plan
Review the key performance indicators against the targets set at the start of the quarter. Show the trend, not just the latest number, and compare with the same quarter last year where seasonality matters. Benchmarking data, such as prior periods or industry references, gives context to performance.
Financial Review
Cover revenue, costs, margin, and cash against budget, and the return on major investments. Flag variances large enough to require a decision.
Strategic Priorities and Major Projects
Report the status of each priority or major initiative. Use a simple status (on track, at risk, off track) with a sentence of explanation and the help needed.
Challenges and Missed Targets
A QBR should include an honest account of what did not go well. Hiding known problems wastes the one meeting designed to fix them, and it damages trust inside the leadership team.
Priorities for the Next Quarter
Agree the top priorities and measurable objectives for the upcoming quarter, with owners. This is the most important output of the meeting.
Action Items and Follow Up
Close with the action items, owners, and deadlines, confirmed aloud before anyone leaves.
How to Prepare for a Quarterly Business Review
Most of the work of a successful QBR happens before the meeting. Preparation lets participants come ready to discuss strategy rather than to read data for the first time.
- Set the date early. Schedule the QBR at a consistent point after quarter close, once financial results are final. Put the next QBR meeting on the calendar before the current one ends.
- Use a standard template. A consistent QBR template makes quarters comparable and cuts preparation time. Each leader fills in the same sections.
- Collect data in advance. Finance and department heads should finalize numbers several days ahead. Use visual data, such as trend lines and simple charts, so the team can see patterns quickly.
- Circulate a pre-read. Send the QBR deck and the agenda in advance and expect people to read it. The meeting time should be spent on discussion and decisions, not presentation.
- Name the decisions. Each section owner should state the decision or help they need. If a slide does not lead to a decision, consider moving it to the appendix.
- Review last quarter's commitments. Bring the action items from the last QBR and report on each one.
A Sample QBR Agenda
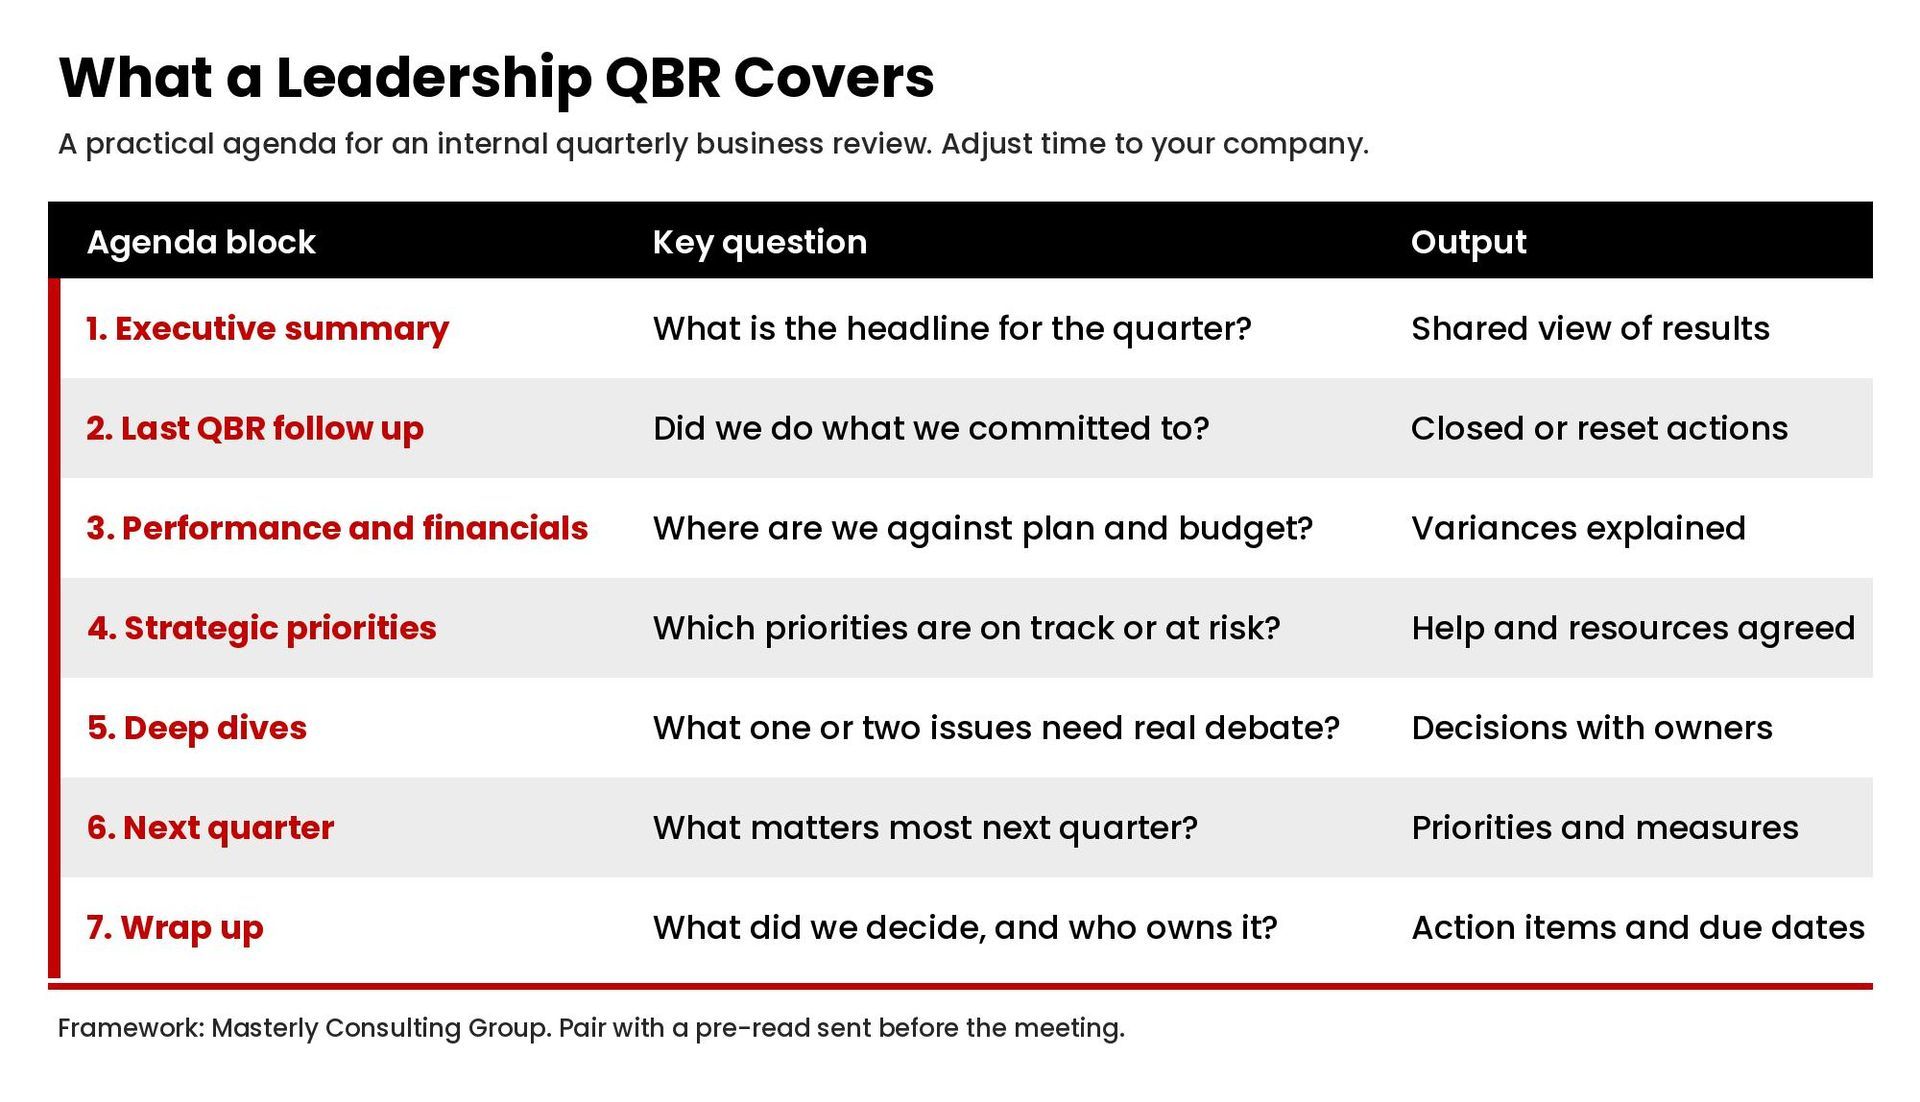
A clear agenda, shared in advance, keeps the meeting on time. Here is a sample quarterly business review agenda for a leadership team. Adjust the time blocks to your company size and the number of priorities.
- Opening and summary. The CEO or meeting owner frames the quarter and the decisions on the table.
- Follow up. Status of each commitment from the previous quarter.
- Performance and financial review. KPIs and financial results against plan, with variances explained.
- Priority status. Status of each priority, risks, and help needed.
- Deep dives. One or two issues that need real discussion, chosen in advance.
- Next quarter's priorities. Agree objectives, owners, and resources.
- Wrap up. Read back decisions and action items; confirm the date of the next QBR.
Keep a time limit for each block. Many guides recommend a customer-facing QBR of about an hour; internal leadership QBRs often need longer, sometimes half a day, because the team is making resource decisions. The point is to set the length deliberately and protect it.
How to Run a Customer QBR
Customer success teams and account managers use the same QBR process with clients, but the purpose shifts. A customer QBR is not a sales pitch. It is a structured review of whether your product or service is helping the customer reach their business goals, and it is one of the best tools for relationship building with senior stakeholders on the customer side.
Start From the Customer's Goals
Before you build a single slide, confirm the customer's goals for the year and how they measure success. If your team keeps success plans for each account, the QBR plan should start there. Ask your main contact what their leadership cares about this quarter, so the review speaks to the customer's business rather than to your feature list.
Show Value With Their Data
Bring usage data, outcomes, and support history that connect to those goals. Where you can, translate activity into results the customer already tracks, such as time saved or process improvements they have confirmed. Never present a number you cannot source from the account's own data.
Keep the Slide Deck Short
A customer-facing QBR presentation works best with a few slides: a summary of the quarter, results against the shared goals, challenges and open issues, recommendations, and next steps. Put the detail in an appendix. If the C suite on the customer side attends, open with the two or three key takeaways that matter to them.
Agree on Next Steps Together
End with shared goals for the next quarter, owners on both sides, and dates. Send a written recap within a day or two. Bring your sales team in only when there is a real expansion or renewal conversation to have, and say so openly, so the meeting stays focused on the customer's results.
Customer QBR Agenda Example
- Introductions and the customer's priorities for the quarter.
- Results against the goals agreed in the previous QBR.
- Challenges, open support issues, and what was done about them.
- Recommendations and roadmap items relevant to the account.
- Next steps, owners, and the date of the next review.
Who Should Attend the QBR Meeting?
Attendance should follow decision rights. The core group is usually the CEO and the leaders who own the company's key results: finance, operations, sales, marketing, product, and people. Add other key stakeholders only for the agenda items that need them.
Assign clear roles:
- Meeting owner: sets the agenda, keeps time, and drives the discussion to decisions.
- Section owners: present their results and state the decision or help they need.
- Note taker: records decisions and action items in real time.
- Finance partner: confirms the numbers and the budget implications of decisions.
For a customer-facing QBR, include both your day-to-day champion and the executive sponsor on the customer side, along with your account manager and customer success manager.
QBR Best Practices
These practices separate strategic QBRs from status meetings:
- Focus on results, not activity. Report what changed in the business, not the list of tasks completed.
- Be honest about misses. The meeting exists to fix problems while there is still time.
- Limit the slides. A short QBR presentation with a strong executive summary is more useful than a long deck.
- Decide in the room. End every major discussion with a decision, an owner, and a date, or an explicit plan to decide. In Microsoft's 2023 Work Trend Index survey of 31,000 workers, 55 percent said next steps at the end of meetings are unclear; a QBR should not add to that number.
- Send a summary quickly. Share decisions and action items within a day or two, while the discussion is fresh.
- Recognize wins. Briefly celebrate results and the people behind them; it reinforces the behavior you want next quarter.
Teams that already have a clear strategy execution process will find the QBR easier, because priorities and measures already exist. Those using a balanced scorecard can use it as the backbone of the performance section.
Common QBR Mistakes
- Turning the QBR into a reporting marathon. If every leader presents every metric, there is no time left for decisions.
- No pre-read. When people see the data for the first time in the meeting, discussion stays shallow.
- Too many priorities. A quarter cannot absorb ten new priorities. Pick a few and fund them.
- No follow up. If action items are not tracked, the next QBR starts from zero.
- Avoiding hard topics. Missed targets that go undiscussed tend to repeat.
Frequently Asked Questions
What Is a QBR Meeting?
A QBR meeting is a quarterly business review: a structured session, held once a quarter, where a team reviews results against the plan and sets priorities for the next quarter. Internally it is run by the leadership team; customer-facing QBRs are run with clients by account or customer success teams.
What Should Be Discussed in a Quarterly Business Review?
Cover an executive summary, performance against plan, a financial review, the status of strategic priorities, challenges and missed targets, priorities for the next quarter, and the action items with owners and due dates.
What Is the Recommended Format for a Quarterly Business Review?
Use a consistent template, a pre-read sent in advance, and a timed agenda: opening, follow up on last quarter, performance and financials, priority status, one or two deep dives, next quarter's priorities, and a wrap up that confirms decisions.
How Often Should You Hold a QBR?
As the name suggests, once per quarter. Some customer-facing programs hold business reviews every three to six months depending on the account.
What Is a Customer QBR?
A customer QBR is a quarterly business review held with a client, usually led by a customer success manager or account manager. It reviews the value delivered against the customer's goals, open challenges, and next steps for the coming quarter.
What Is the Difference Between a QBR and an Annual Operating Plan?
The annual operating plan sets the targets, budget, and priorities for the year. The QBR checks progress against that plan each quarter and adjusts priorities as conditions change.
Make Your Next QBR Count
If your quarterly reviews feel like status updates that change nothing, Masterly Consulting Group can help you redesign the QBR and the management rhythm around it. Contact the firm to plan a working session on your quarterly review, priorities, and follow-through.
Sources: Microsoft, "Will AI Fix Work?" 2023 Work Trend Index, May 9, 2023.